
For the first time, decades of scientific data provide an understanding of Lake Winnipesaukee's present conditions and possible futures.
4
0
5
0
0
7
6
5
4
3
2
1
+
3
0
5
0
2
4
3
2
1
3
0
5
0
K
1
0
5
0
M+
9
0
5
0
0
5
4
3
2
1
K
The State of the Lake


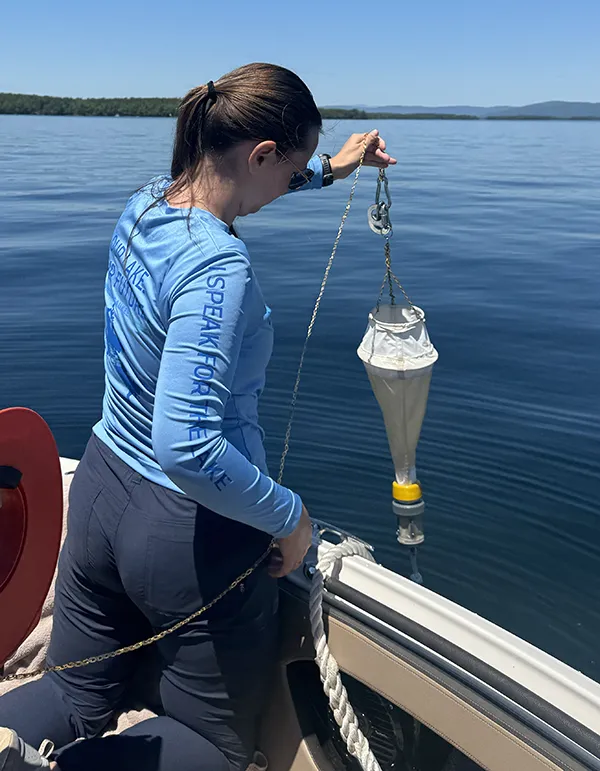
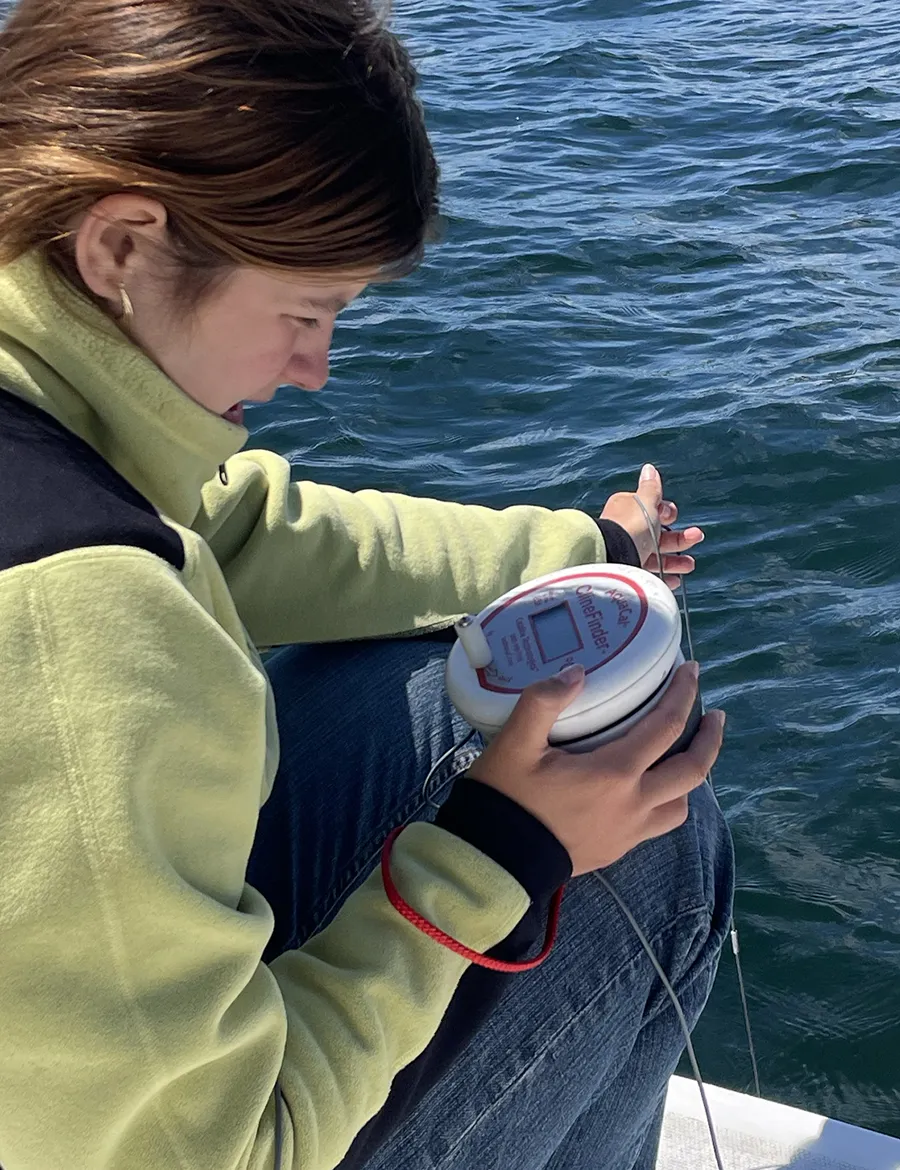
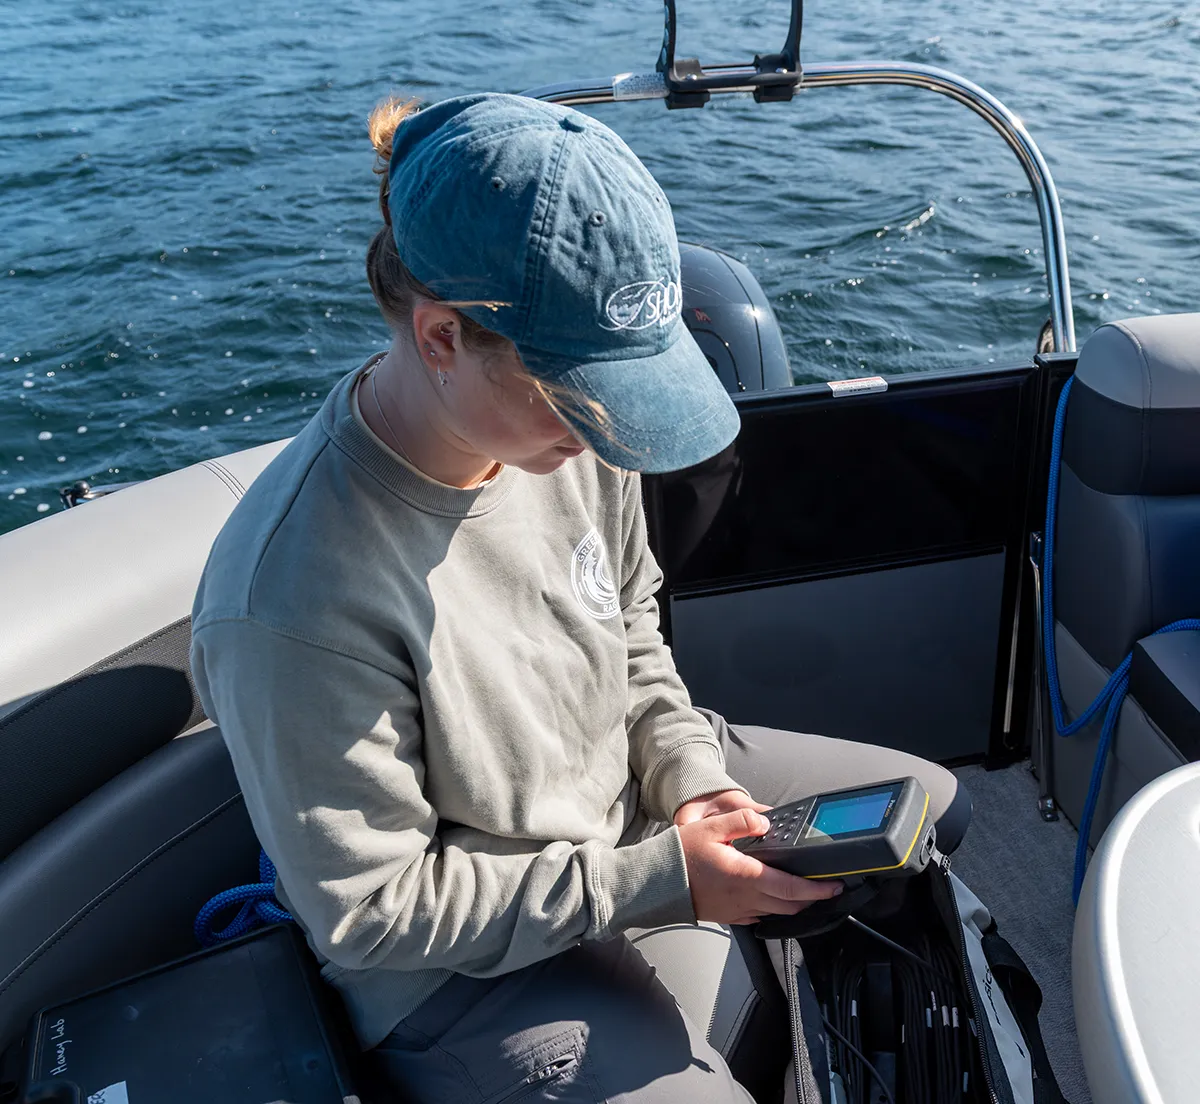

The State of the Lake
Signs of serious threats to lake health have been documented across multiple measures of water quality decline. Most visible were the cyanobacterial blooms in the summer of 2024 that impacted numerous locations, turning the lake’s clear water pea soup green, unsafe for swimming or other recreational activities.
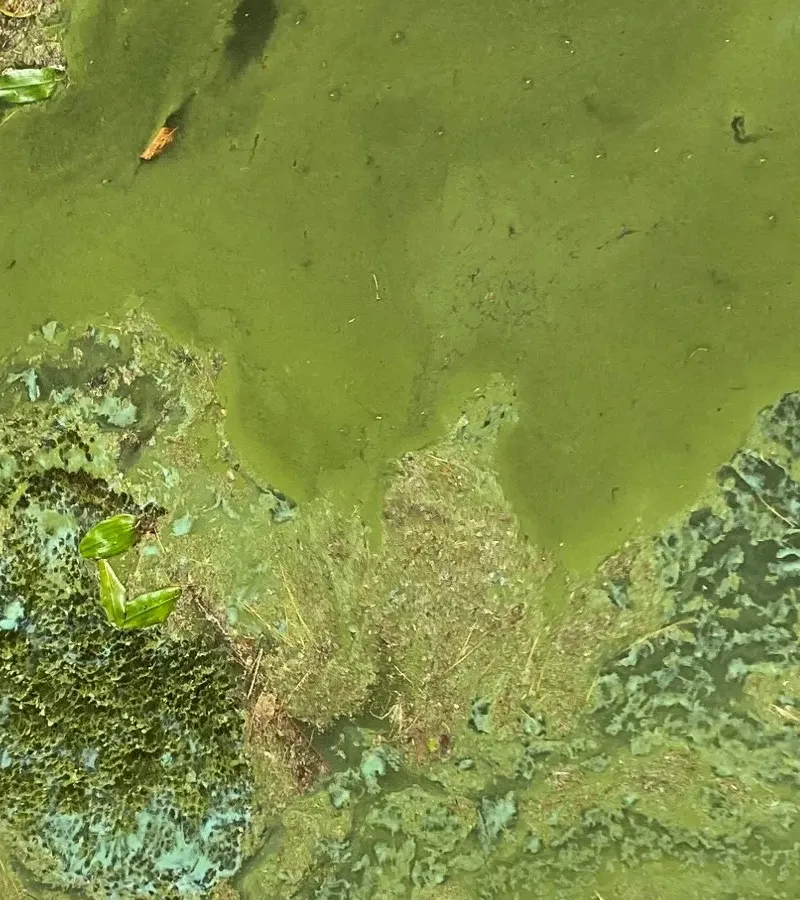
Dolly Island
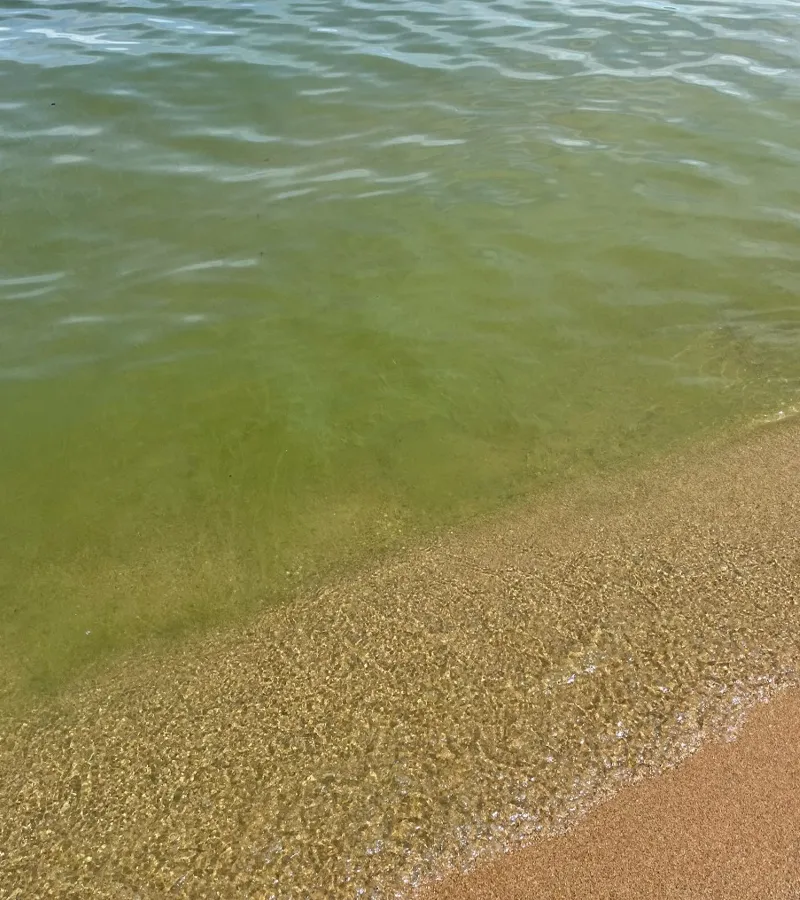
Cedar Cove
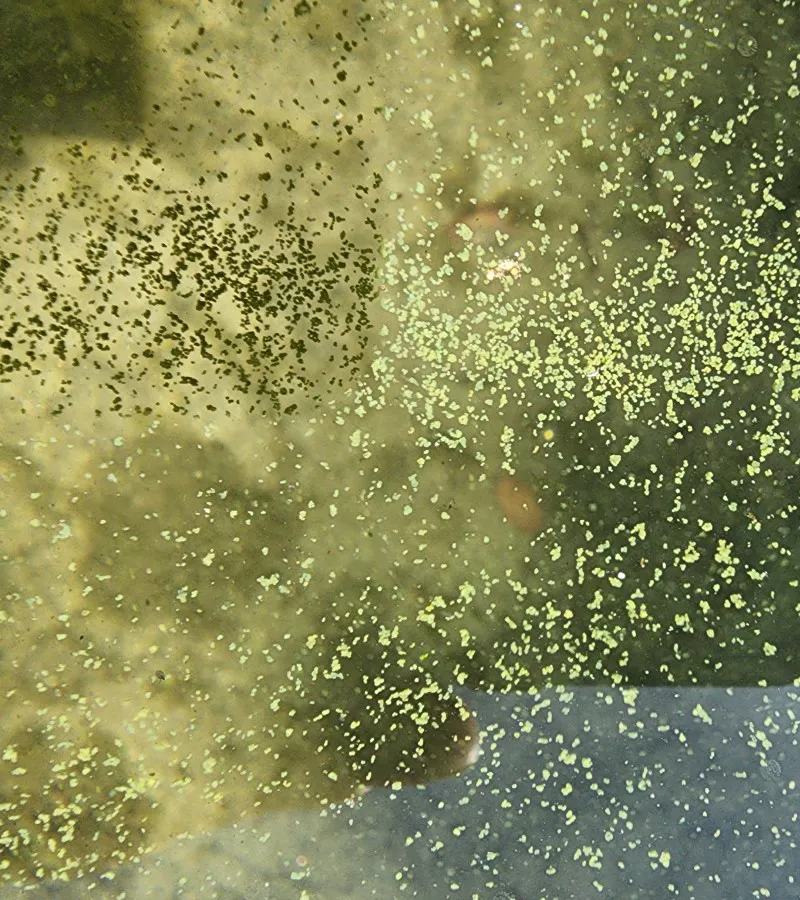
The Broads
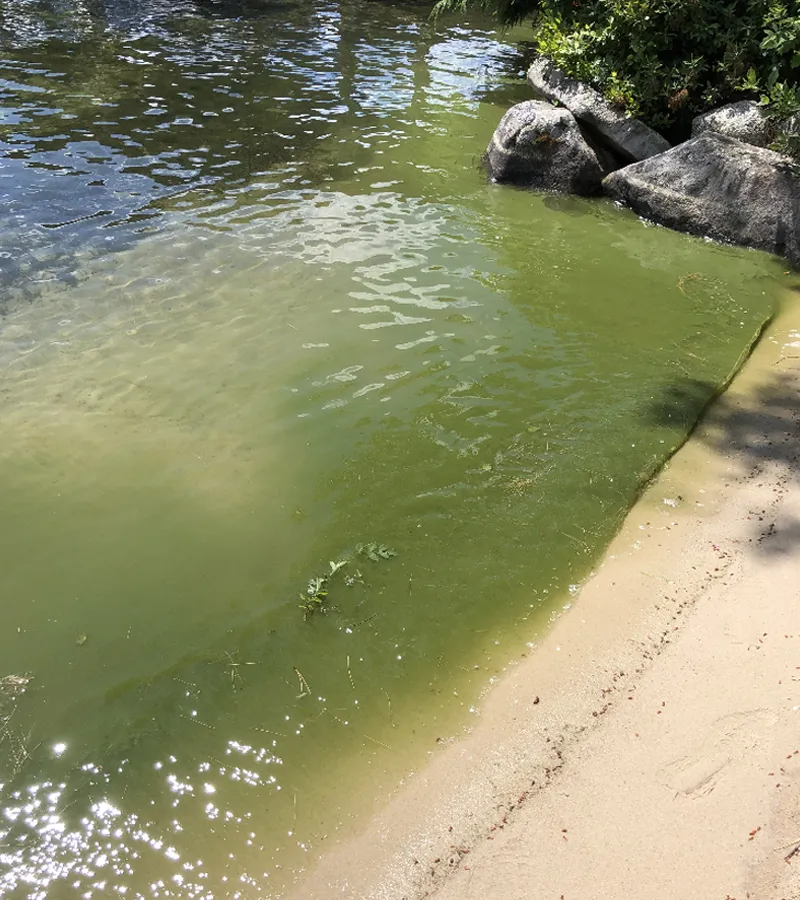
Jockey Cove
The blooms were a wake-up call that spurred many to ask why they were occurring and what was needed to reduce the risk of future blooms.
The Data Reveal Troubling Trends
Too Much Phosphorus is Entering the Lake
Phosphorus is the primary limiting nutrient fueling algal growth and cyanobacterial blooms in New Hampshire lakes. Monitoring data from 1985 to 2025 reveal a measurable increase in Lake Winnipesaukee phosphorus levels. The lake holds approximately 625 billion gallons of water, and a detectable increase in a body of water this large is a significant indicator that the ecological balance is under growing stress.
Bloom-feeding phosphorus levels have increased to a total of 20,340 lbs–over 10 tons–entering the lake annually from the land and tributaries that drain to the lake. This sum is projected to rise by 38% in the decades ahead.

Annual Phosphorus Load to Lake Winnipesaukee from Stormwater and Tributaries
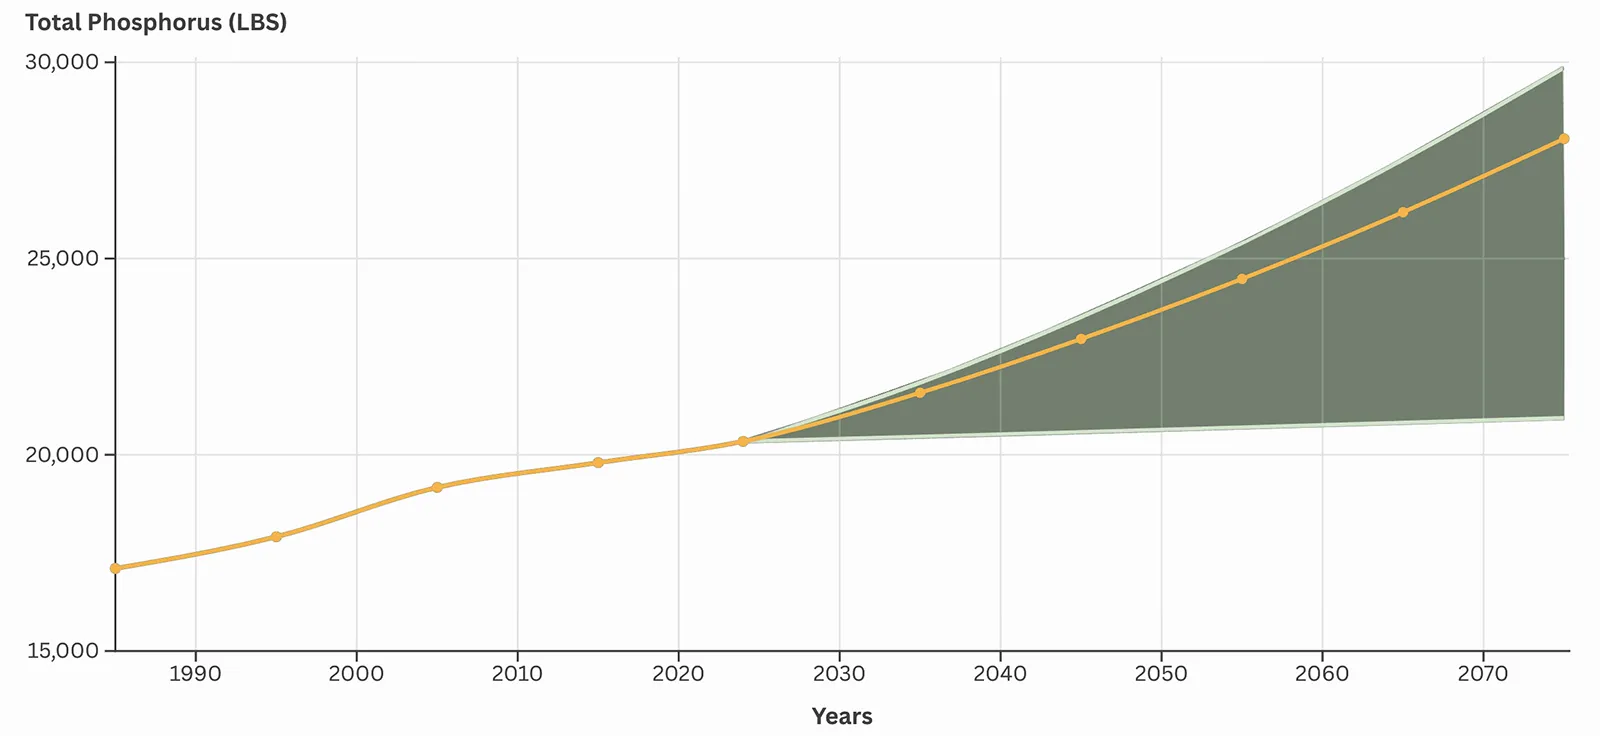
This graph shows the modeled annual total phosphorus load entering Lake Winnipesaukee from stormwater and tributaries from 1985 to 2075. For the future scenario, the orange line shows phosphorus loading estimates based on the 30-year population growth rate for the watershed. The shaded area depicts a range of projections depending on the trend in population growth.

...people aren’t making the connection between what’s going on in the landscape and what’s happening with the water. Something’s got to change, because the path we are on is unsustainable.
Dan Egan, Author of The Devil’s Element: Phosphorus and a World out of Balance. Quote from Resources Radio Podcast.
Cyanobacteria are Increasing
A seven-year trend shows cyanobacteria abundance increased by 23% per year on average across nine sampling sites. A major spike occurred in 2024, when cyanobacterial blooms impacted most of the lake. Given present trends and the compounding effects of a changing climate, cyanobacterial blooms threaten to become the new normal for Lake Winnipesaukee.
Cyanobacterial blooms can produce cyanotoxins that pose risks to people and animals. While not every bloom is toxic, and toxin levels can vary, sampling in Lake Winnipesaukee confirmed the presence of cyanotoxins in several of the 2024 blooms.
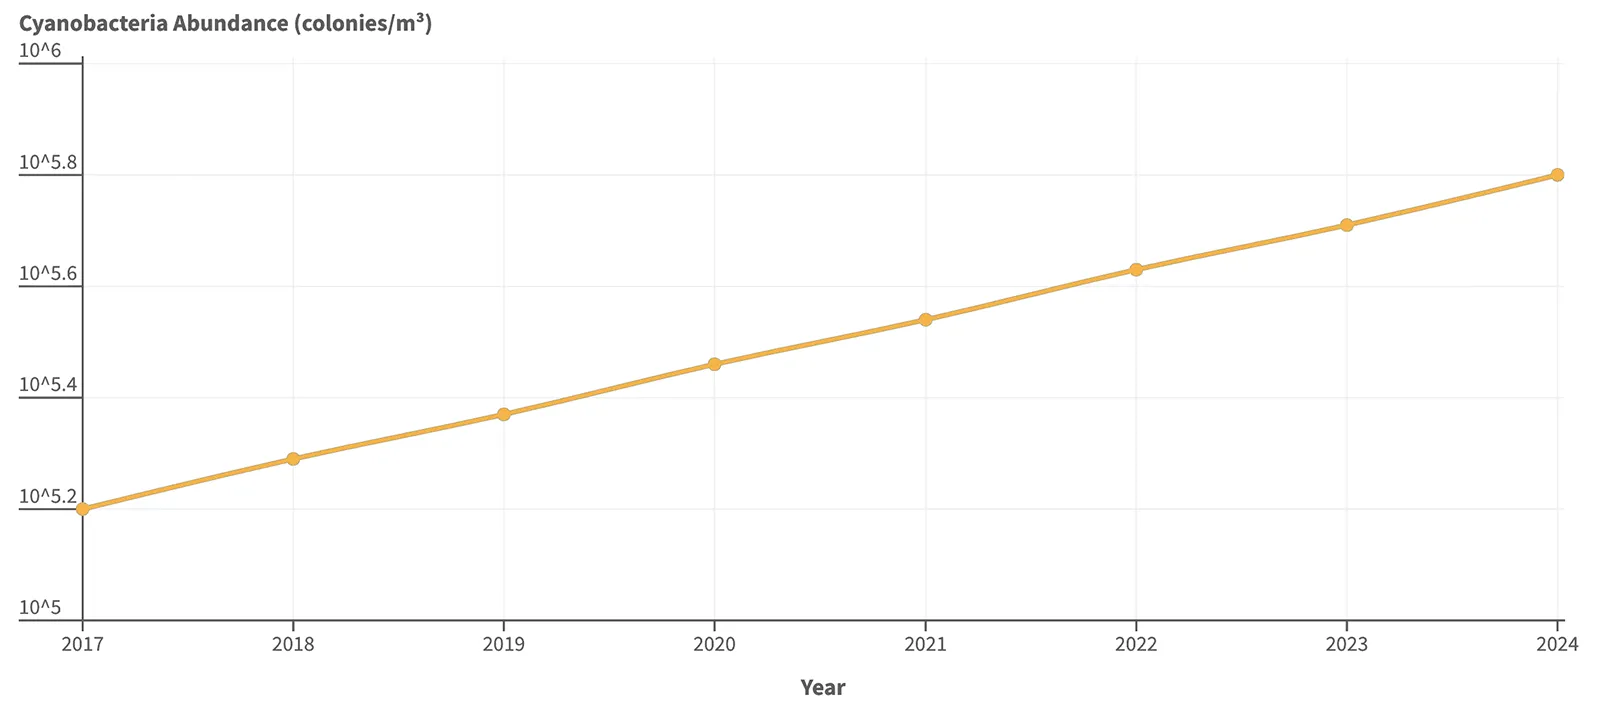
This graph shows the trend in cyanobacteria abundance across nine deep water sampling locations in Lake Winnipesaukee from 2017 to 2024. Cyanobacteria abundance, on average, increased 23% per year. These data were collected by the New Hampshire Department of Environmental Services (NHDES) as part of their Spiny Water Flea Study.
People don’t want to come up here and not be able to enjoy the water.
Peggy Ames, Fifth-generation Innkeeper at Ames Farm Inn, Gilford, NH. Boston Globe, June 25, 2025
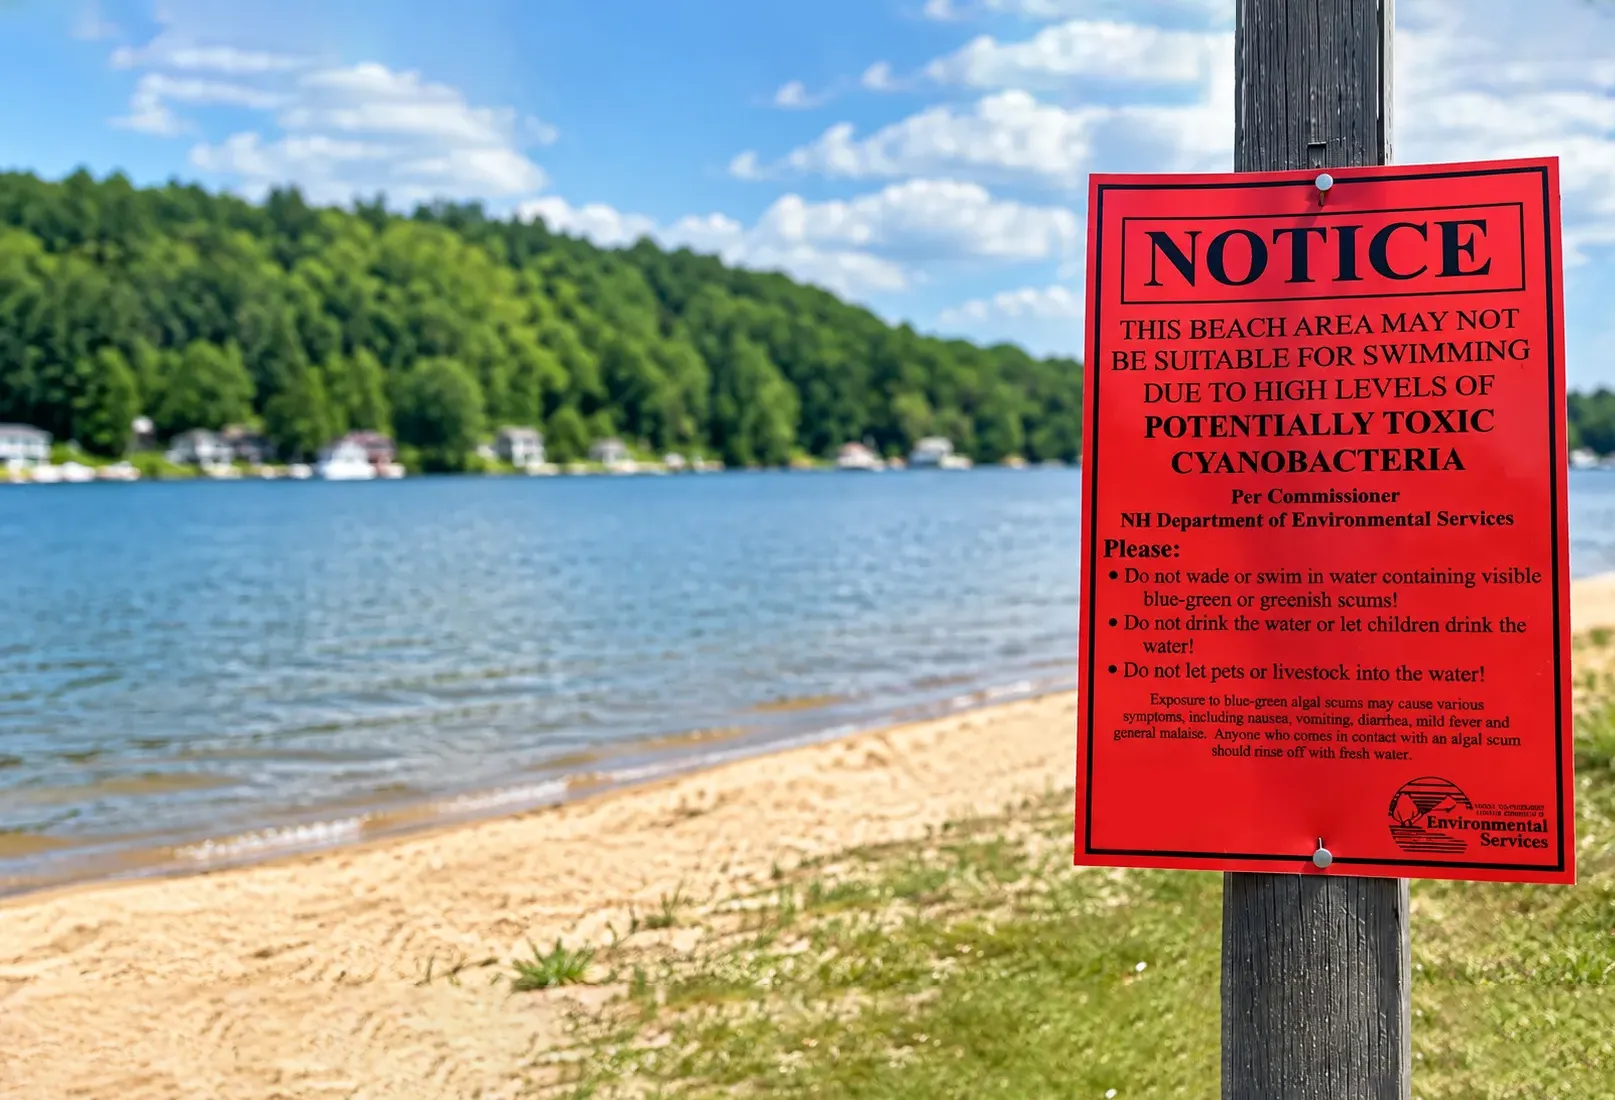
A Warning Sign for People and Pets
Exposure to cyanotoxins can cause symptoms ranging from headaches, skin irritation, and gastrointestinal illness to liver or neurological effects. Children and pets are particularly vulnerable, and exposure can be fatal for dogs. Because children are smaller, cyanotoxin exposure can result in a higher dose relative to body weight. Children and dogs are also more likely to ingest the water, with dogs facing the additional risk from licking their fur after swimming.
A warning notice from 19 Mile Beach on Lake Winnipesaukee in Tuftonboro, NH, on June 14, 2024 (AP Photo/Nick Perry)
The Lake is Losing Water Clarity
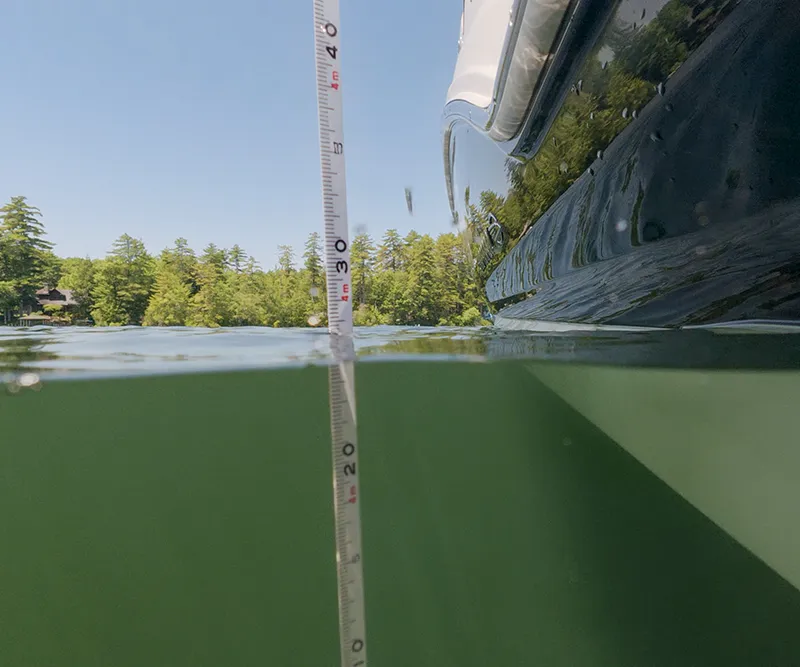
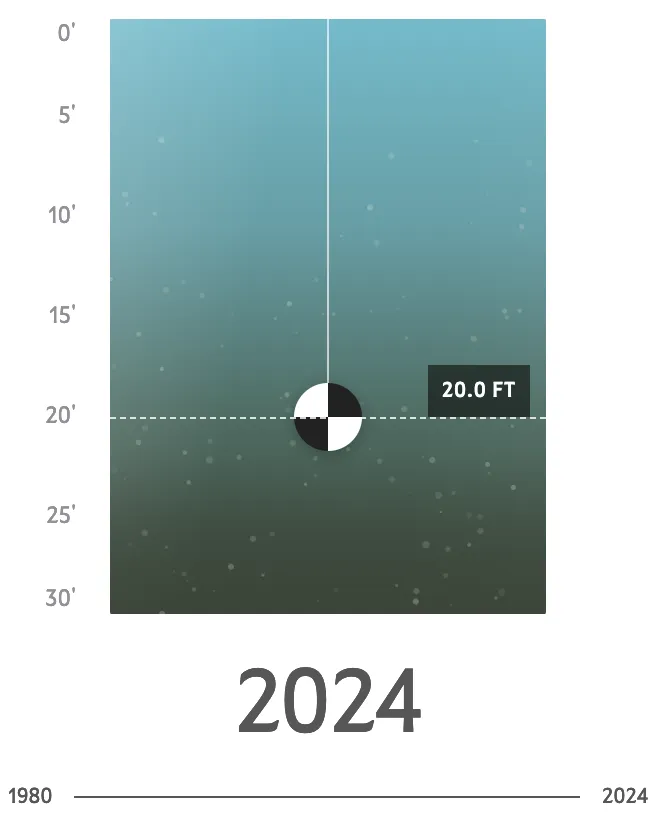
Lake Winnipesaukee is steadily losing its signature feature, crystal-clear water. Over the past 40+ years, water clarity has diminished on average by more than eight feet. The loss is alarming and signals that the lake’s water quality is at risk of lasting decline.
Lake Winnipesaukee is naturally a clear, low-nutrient lake. Lakes change over thousands to tens of thousands of years. However, what happens on the land surrounding the lake can accelerate this process, leading to a much different, greener and less clear lake.
Bob Craycraft, Lakes Lay Monitoring Program Coordinator, University of New Hampshire Cooperative Extension
The Secchi disk is used to measure water clarity. The deeper the disk remains visible, the more transparent the lake water.




Fishing is Threatened
Lake Winnipesaukee’s status as a world-class freshwater fishery is at risk. Recent data shows a dramatic drop-off in the forage fish that sustain prized game fish such as lake trout, rainbow trout, and landlocked salmon.
One contributing factor may be a recently discovered aquatic invasive species. Winnipesaukee is believed to be one of only three New Hampshire lakes inhabited by spiny water flea, an aggressive invasive zooplankton first detected in 2023. As described by NAISMA, invasive species specialists, the invasive spiny water flea devastates freshwater ecosystems by aggressively consuming native zooplankton, depriving forage fish of their primary food source.
Landlocked salmon and rainbow trout stocking rates are based on forage fish abundance, mostly rainbow smelt. Reduced smelt numbers translate into reduced stocking rates, which impacts the quantity of these gamefish species available to anglers. Additional surveys will be required to determine whether the unprecedented declines depicted will continue.
Lake trout, managed via natural reproduction, have exhibited very poor body condition given reduced smelt abundance, a primary prey species.
Recent Decline in Pelagic Forage Fish Abundance
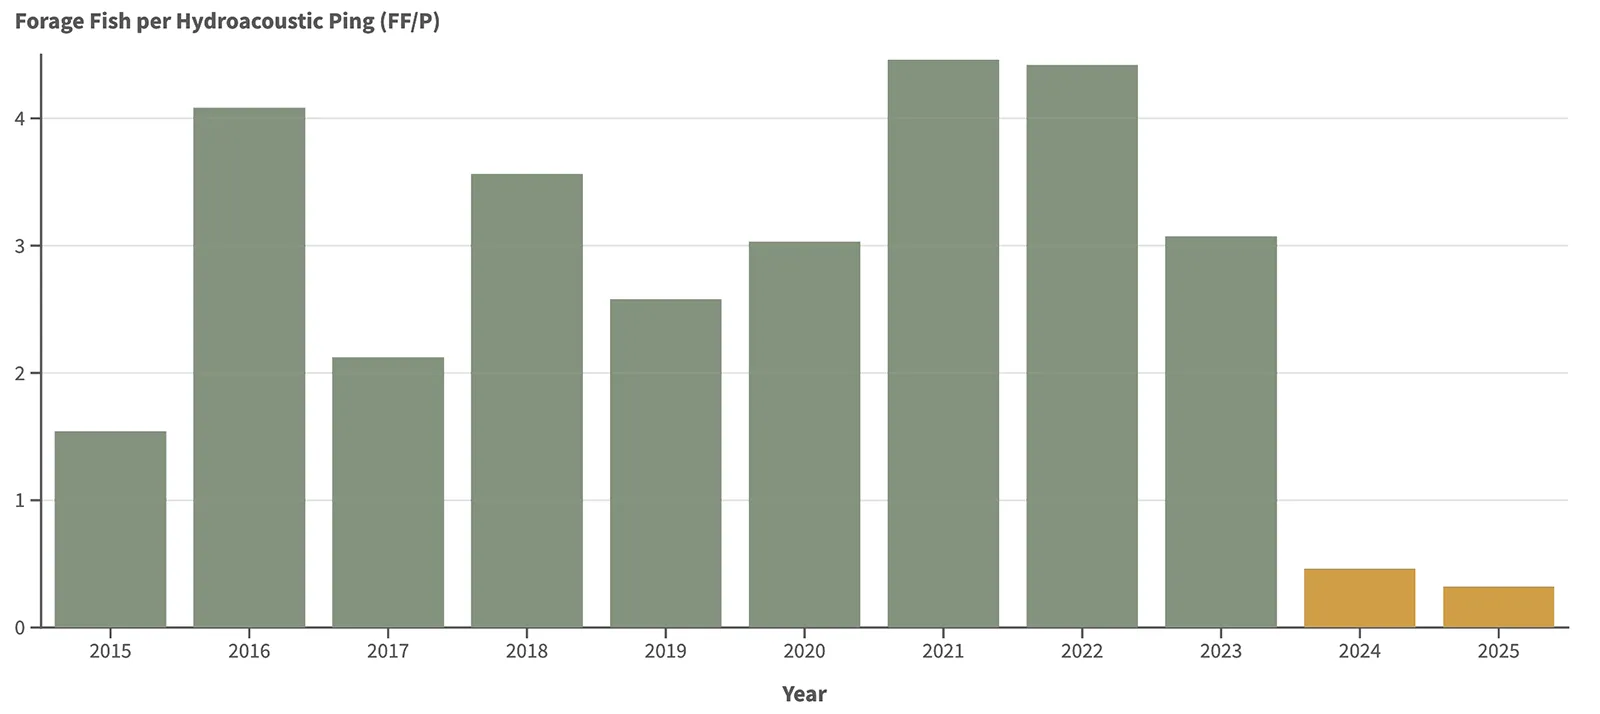
This chart shows the abundance of pelagic forage fish in Lake Winnipesaukee, per sonar surveys conducted by the New Hampshire Fish and Game Department. The sharp declines in 2024 and 2025 indicate substantially fewer pelagic forage fish than in previous years.
Regional Economy at Risk
A 2021 Dartmouth College study focused on the eight shoreline communities calculated Lake Winnipesaukee’s economic value to be over $17 billion, of which $16.5 billion is total assessed property value. The remaining amount comes from town tax values, revenues from tourism, boating and fishing, summer camps, and water supply. These would all be jeopardized by continued water quality decline. The lake’s economic value has likely increased since this study was conducted.
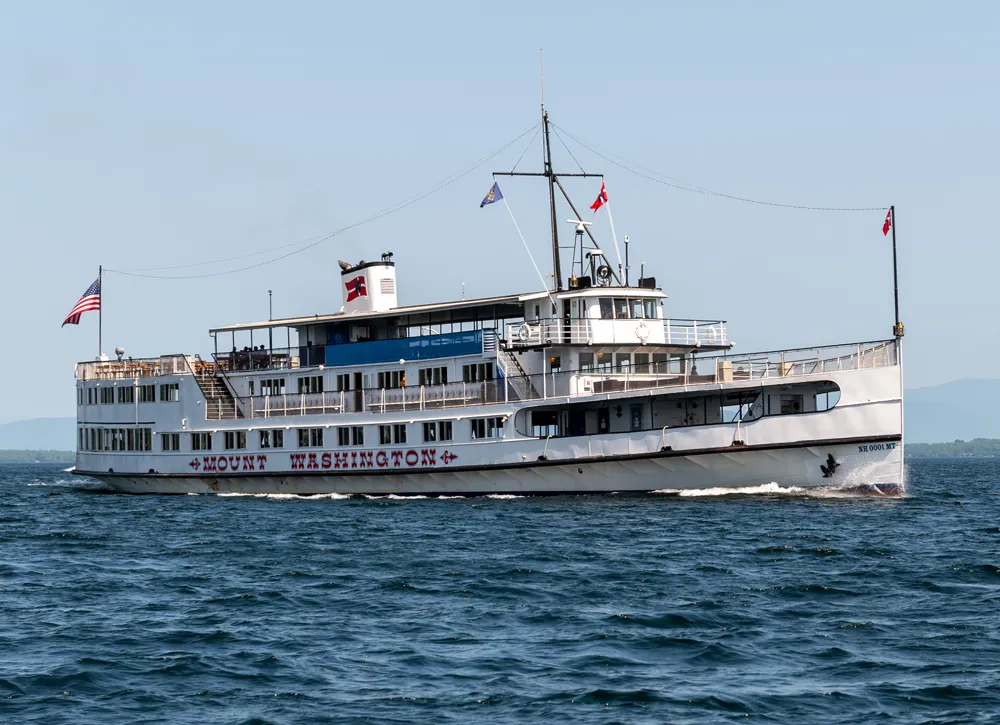

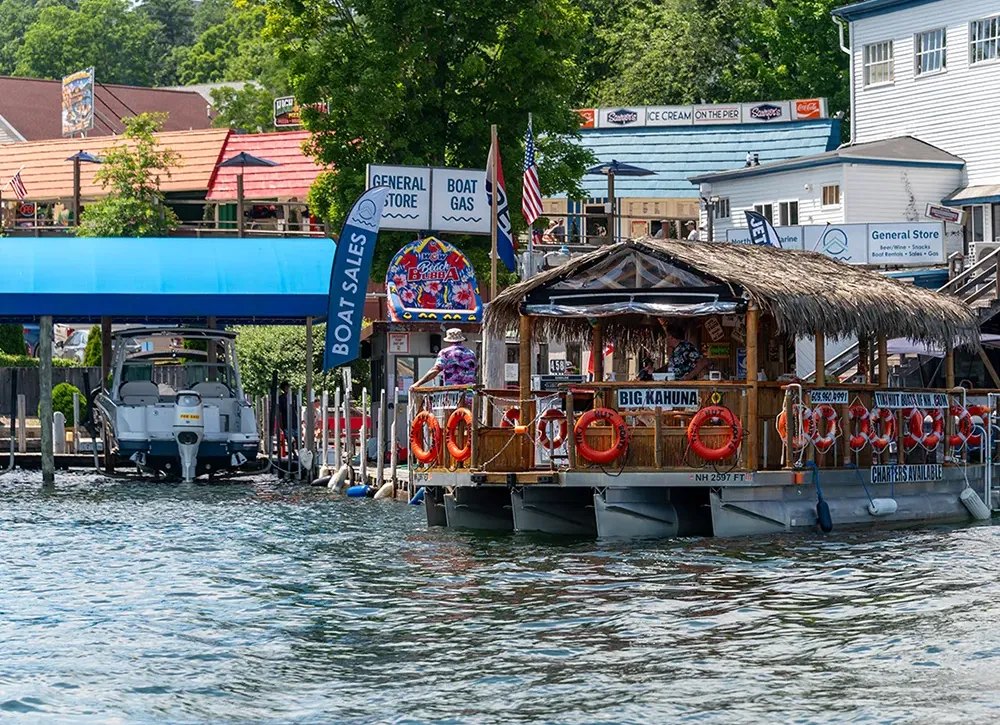
Could this be Lake Winnipesaukee’s future?
Lake Champlain, in neighboring Vermont, reveals what the economic future could look like if declines continue. A 2015 study by the University of Vermont revealed that a three-foot decrease in water clarity would lead to:

$12.6 million reduction
in tourism revenues
$16.8 million reduction
in total economic activity
The same study also found that a three-foot increase in water clarity is equated with:

37% average increase
in seasonal home value
3% average increase
in single-family home value
This lake is the center of this region. It is the reason that people come here from all over the world. If our lake is in danger, then our livelihood is in danger.
Bob Manley, Owner of Hermit Woods Winery in Meredith, NH. Boston Globe, June 25, 2025
Primary Causes of Decline




Primary Causes of Decline
What Happens on the Land, Happens to the Lake
Loss of Protective Natural Land Cover
The natural forests, fields, and wetlands in a watershed soak up algae-feeding nutrients, providing an invaluable buffer for the lake. Once one fifth of natural land cover is lost, a watershed’s ability to compensate can deteriorate rapidly. Lake Winnipesaukee will likely pass that critical threshold within a decade.
Increase in Impervious Surface
Accompanying the loss of natural land cover in the watershed is an increasing amount of roads, buildings, and other impervious surfaces that can’t hold nutrients back from the lake. The extent of impervious surfaces in a watershed is one of the strongest predictors of stream and lake health. At 10% impervious cover, aquatic ecosystems begin to show measurable stress. As impervious cover approaches 25% in coming decades, severe ecological impacts can be expected.
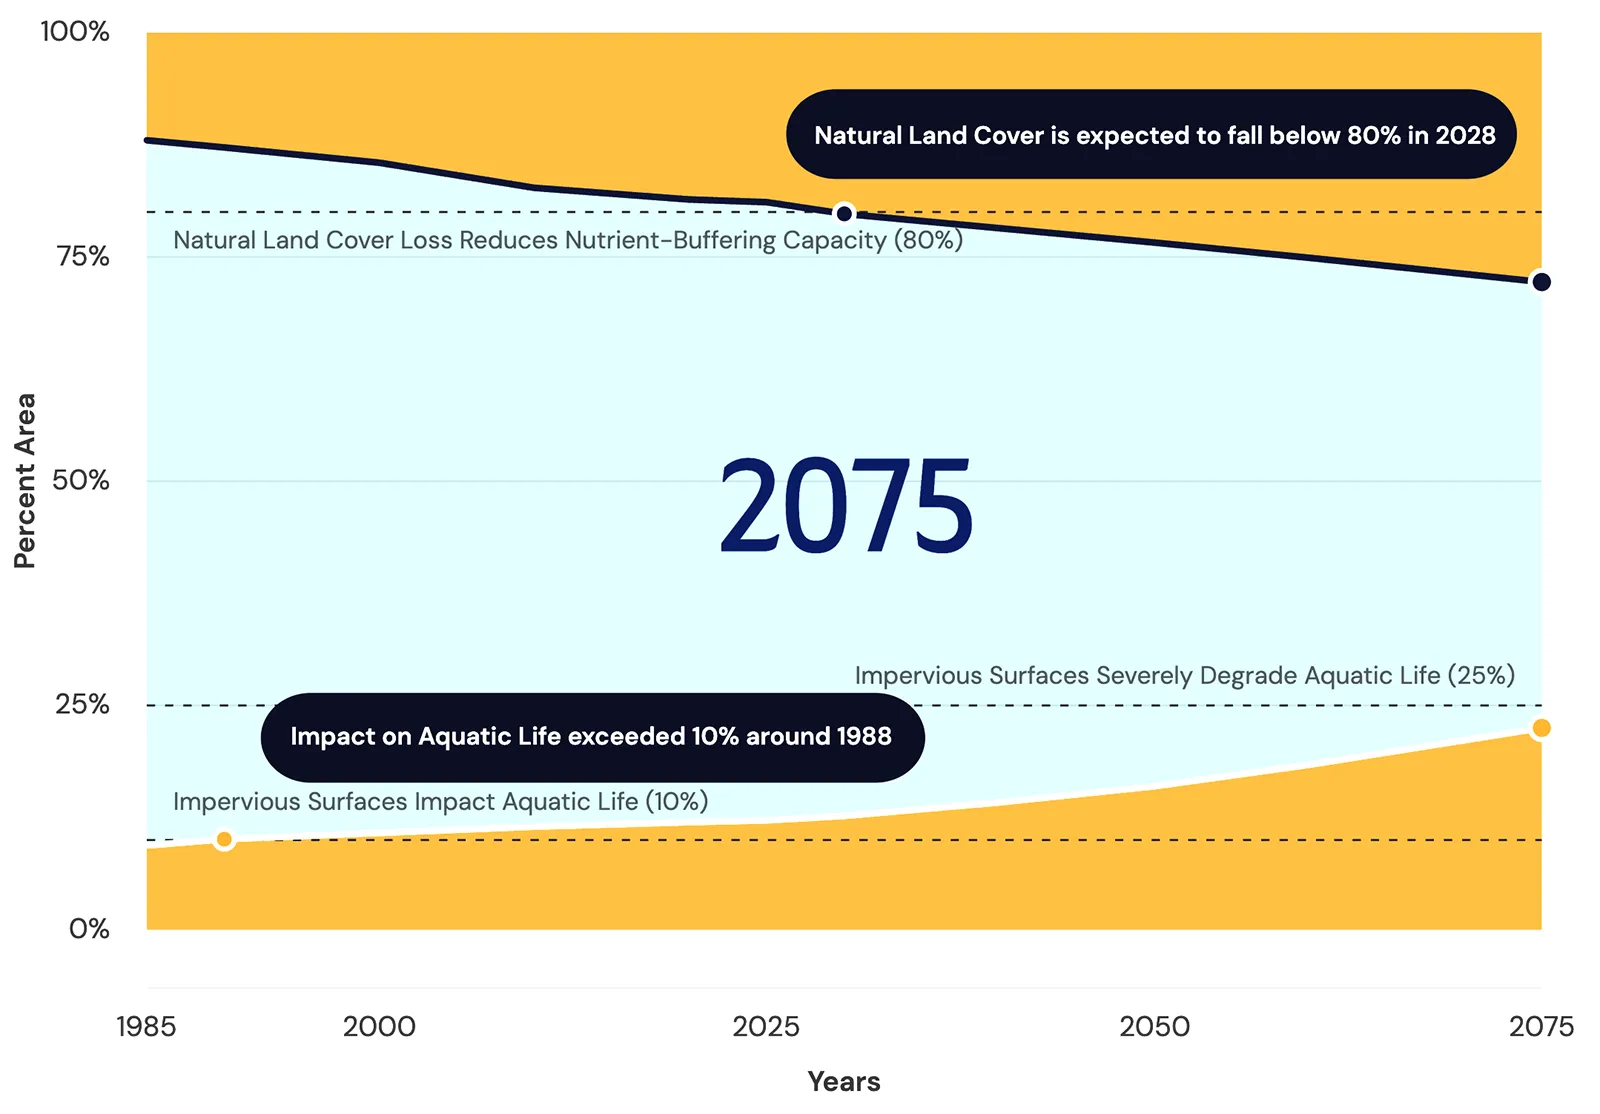
“With every new home built nearly an acre of forest is lost once you account for the roofs, driveways, roads, and businesses built to support it. Our models show that the watershed could eventually have enough impervious surface to cover an area almost the size of the entire lake.”

Amalia Handler, PhD, Limnologist, FB Environmental Associates
Development Will Continue. How, and Where, Matters.
Currently, there are approximately 27,000 buildings in the watershed. By 2075, there is the potential for an additional 17,600 buildings — a 65% increase. Since much or all of this development will happen, the strategies used to develop in ways that protect water quality are essential.
Shorelines are Particularly Important
New Hampshire recognizes that shorelines provide an invaluable service to water quality. The Shoreline Water Quality Protection Act establishes basic standards for development within 250 feet of the lake. With 90% of Lake Winnipesaukee’s 277 miles of shoreline privately owned, the choices made on these properties play a significant role in the lake’s future.
New Hampshire Shoreline Water Quality Protection Act
Section 483-B:1 . Purpose statement
The shorelands of the state are among its most valuable and fragile natural resources, and their protection is essential to maintain the integrity of public waters.
Continue Reading
I-a. A natural woodland buffer, consisting of trees and other vegetation located in areas adjoining public waters, functions to intercept surface runoff, wastewater, subsurface flow, and deeper groundwater flows from upland sources and to remove or minimize the effects of nutrients, sediment, organic matter, pesticides, and other pollutants and to moderate the temperature of the near-shore waters.
I-b. Scientific evidence has confirmed that even small areas of impervious surface coverage can have deleterious impacts on water quality and the aesthetic beauty of our lakes and rivers if not properly contained or managed within each watershed. These impacts are known to reduce recreational opportunity, reduce property values, and pose human health risks.
II. The public waters of New Hampshire are valuable resources held in trust by the state. The state has an interest in protecting those waters and has the jurisdiction to control the use of the public waters and the adjacent shoreland for the greatest public benefit.
III. There is great concern throughout the state relating to the utilization, protection, restoration and preservation of shorelands because of their effect on state waters.
IV. Under current law the potential exists for uncoordinated, unplanned and piecemeal development along the state's shorelines, which could result in significant negative impacts on the public waters of New Hampshire.
Source. 1991, 303:1. 2002, 263:1. 2008, 171:15, eff. July 1, 2008.
Increasing Stormwater, Septic, and Salt are the Primary Causes of Decline
Stormwater runoff and erosion at Lake Winnipesaukee in 2026.
Polluted Stormwater Runoff is Replacing Naturally Filtered Groundwater that Flows Into the Lake
As forests are replaced by roads, buildings, parking lots, driveways, other impervious surfaces, and lawns, less rain and snow soaks into the ground. Rather than recharging groundwater as baseflow (shown below), water rushes over these surfaces and into storm drains, ditches, and ultimately the lake.
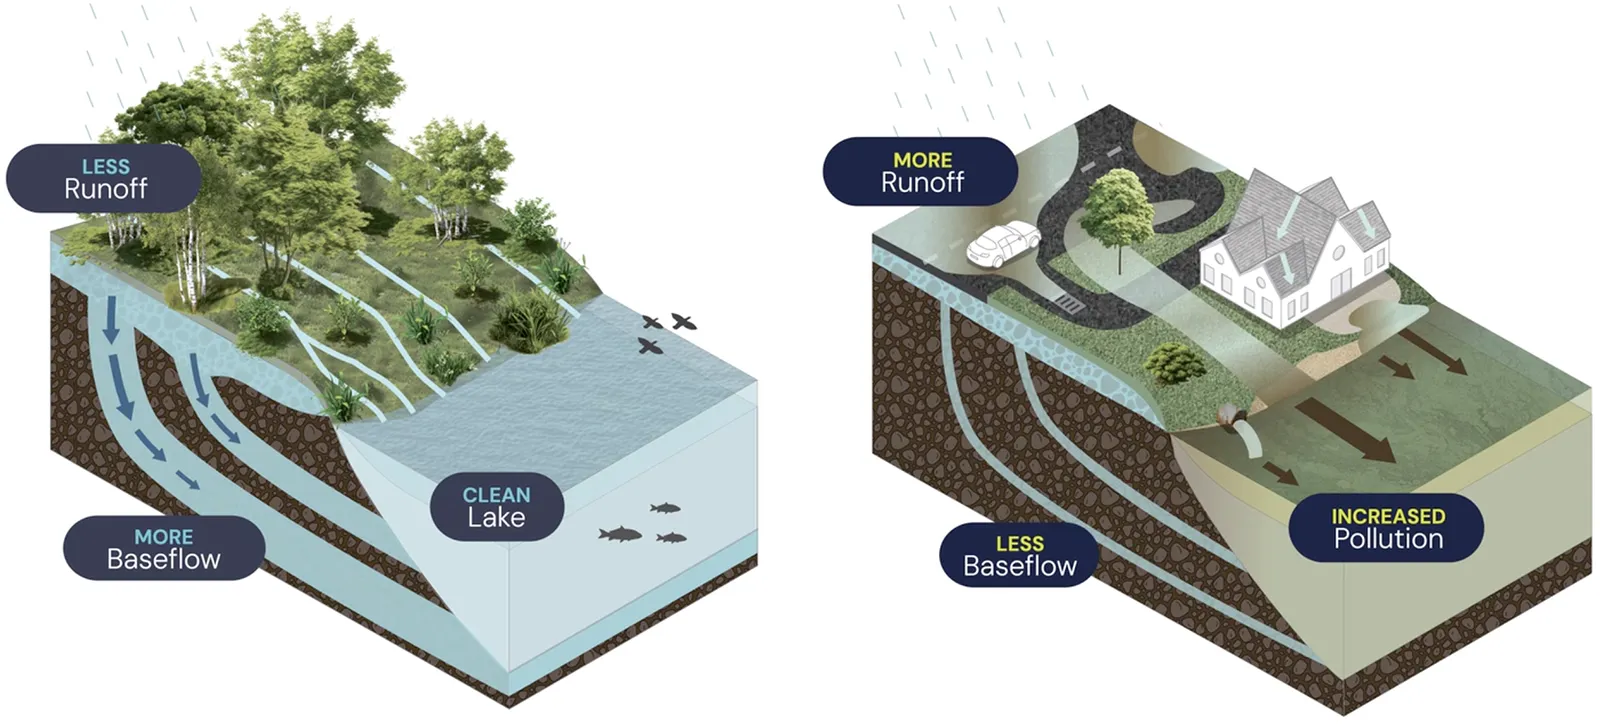
This stormwater runoff contains a toxic mix of pollutants and sediments, including road salt, fertilizers, motor oil, heavy metals, pesticides, and pet waste. Even natural materials from human activities, such as lawn clippings, degrade water quality and impact aquatic life.
The concentration of pollutants entering the lake will continue to rise without adjusting how and where development occurs.
Every Year, 44.5 Billion Gallons of Stormwater Runoff Flow Into Lake Winnipesaukee
The amount of stormwater reaching the lake could increase by approximately 3 billion gallons by 2075 based on development trends.
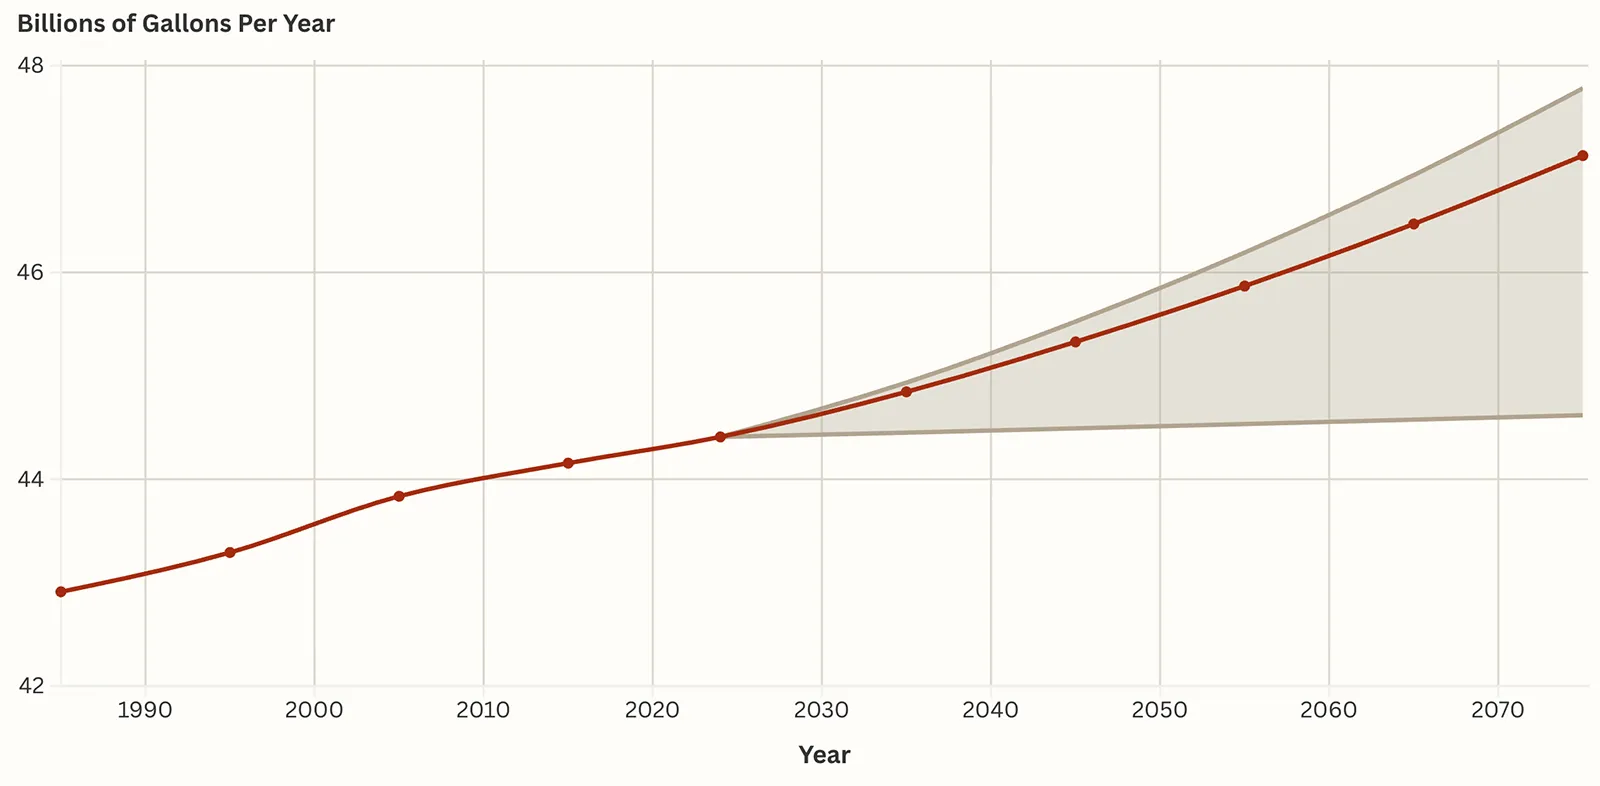
This red line shows the increase in stormwater runoff entering Lake Winnipesaukee annually from 1985 to 2075. The modeled volume is based on past, current, and future projected land use. The shaded cone depicts a range of possible outcomes depending on the rate of future development.
Septic Systems in At-Risk Locations Increase Pollution Reaching the Lake
Every day, 1.6 million gallons of septic system effluent, containing hundreds of pounds of phosphorus and thousands of pounds of chloride and nitrogen, enter watershed soils from 19,000 septic systems. Not yet known, but likely adding to the problem, is what may be leaking from roughly 15,000 sewer connections and hundreds of miles of aging sewer infrastructure in the watershed.
An additional 17,000 septic systems could be added in the watershed by 2075. As depicted in the map below, many systems are located in at-risk locations that do not support proper system function. This leads to higher volumes and concentrations of effluent reaching groundwater and the lake.
Each dot represents a building with a septic system in moderate, high, or very high risk locations. The risk categories are derived from a formula that considers soil characteristics, flood zones, areas near wetlands or waterbodies, soils with shallow groundwater, shallow bedrock, low permeability, and/or coarse sands and gravels that provide little filtering capacity. Systems on low and moderately low risk soils are not included.
“Protecting Lake Winnipesaukee from the detrimental impacts of failing or outdated septic systems is essential to preserving the lake’s water quality, ecological balance, and economic value.”

Dr. Sara Heger, Recognized Expert in Wastewater Treatment
Rising Salt Levels Are Increasing Stress on the Ecosystem
Chloride, a primary component of salt, has steadily risen in Lake Winnipesaukee for the past 40 years. The current chloride level in Lake Winnipesaukee is double the natural level of chloride in New Hampshire lakes. This increase reflects the expansion of roads in the watershed. Projected expansion of surfaces requiring winter maintenance that employ current practices could lead to chloride concentrations that are six times the natural background level, further intensifying impacts to the ecosystem. Salt can also seep into groundwater, where elevated chloride can impact the 6,647 drinking water wells in the watershed.
As research shows, “high levels of chloride and other salt ions can kill freshwater animals, from zooplankton at the base of the food web to insects and fish.” It can also interfere with a lake’s natural mixing, limiting the movement of oxygen into deeper waters and altering how nutrients move through the system.
Historic & Projected Lake Chloride Concentration
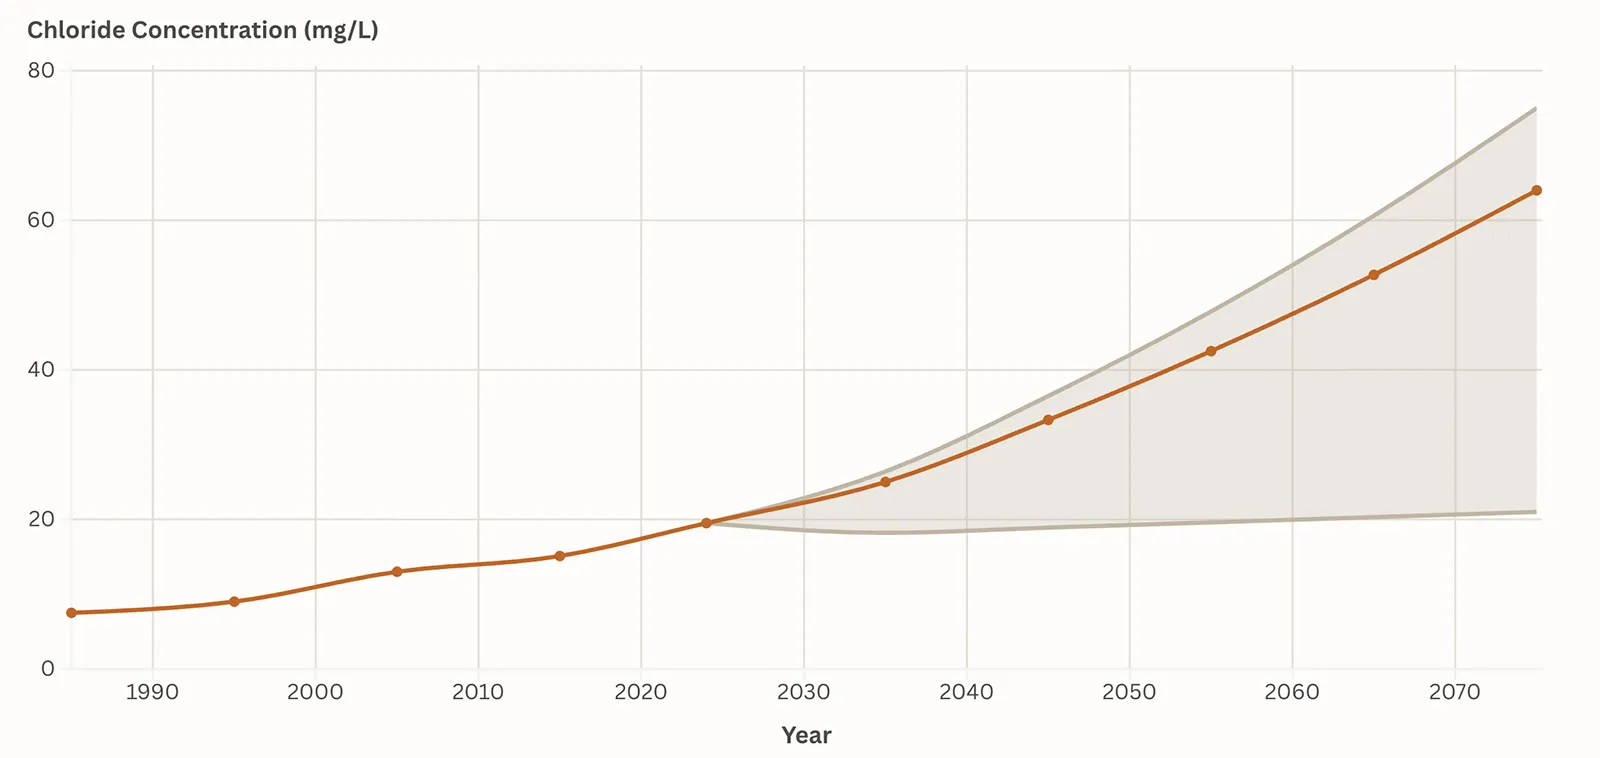
The red line shows the modeled total chloride concentration in Lake Winnipesaukee annually from 1985 to 2075. The shaded cone depicts a range of projections depending on future development trends.
“Road salt pollution is known as the acid rain of our time, because it is so destructive. Unlike acid rain, however, road salt pollution can be solved locally, here and now, at its source. We already have a proven model for how to do it that can be implemented at Lake Winnipesaukee today.”

Phill Sexton, Managing Director, WIT Advisers
The Fate of the Lake


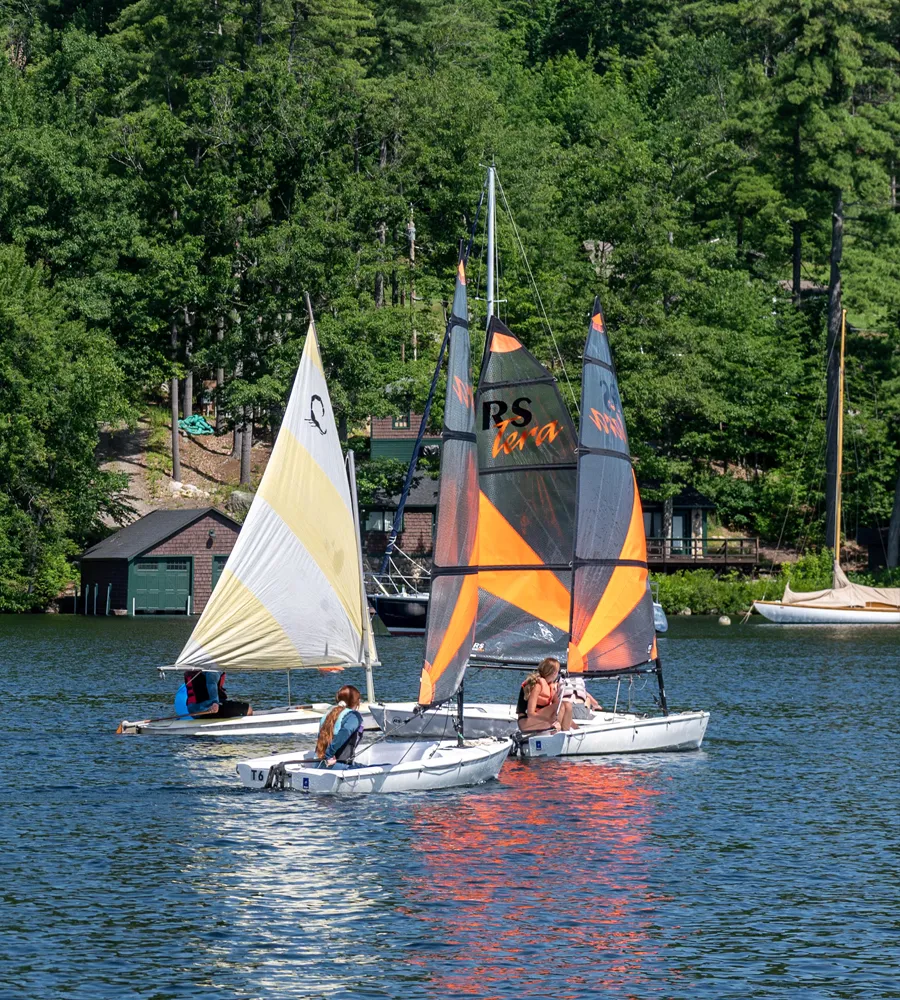
A Legacy at Risk
With what is now known about the state of Lake Winnipesaukee, the fate of the lake will be determined by whether and how this information is applied.
The Fate of the Lake
We Face Two Possible Futures
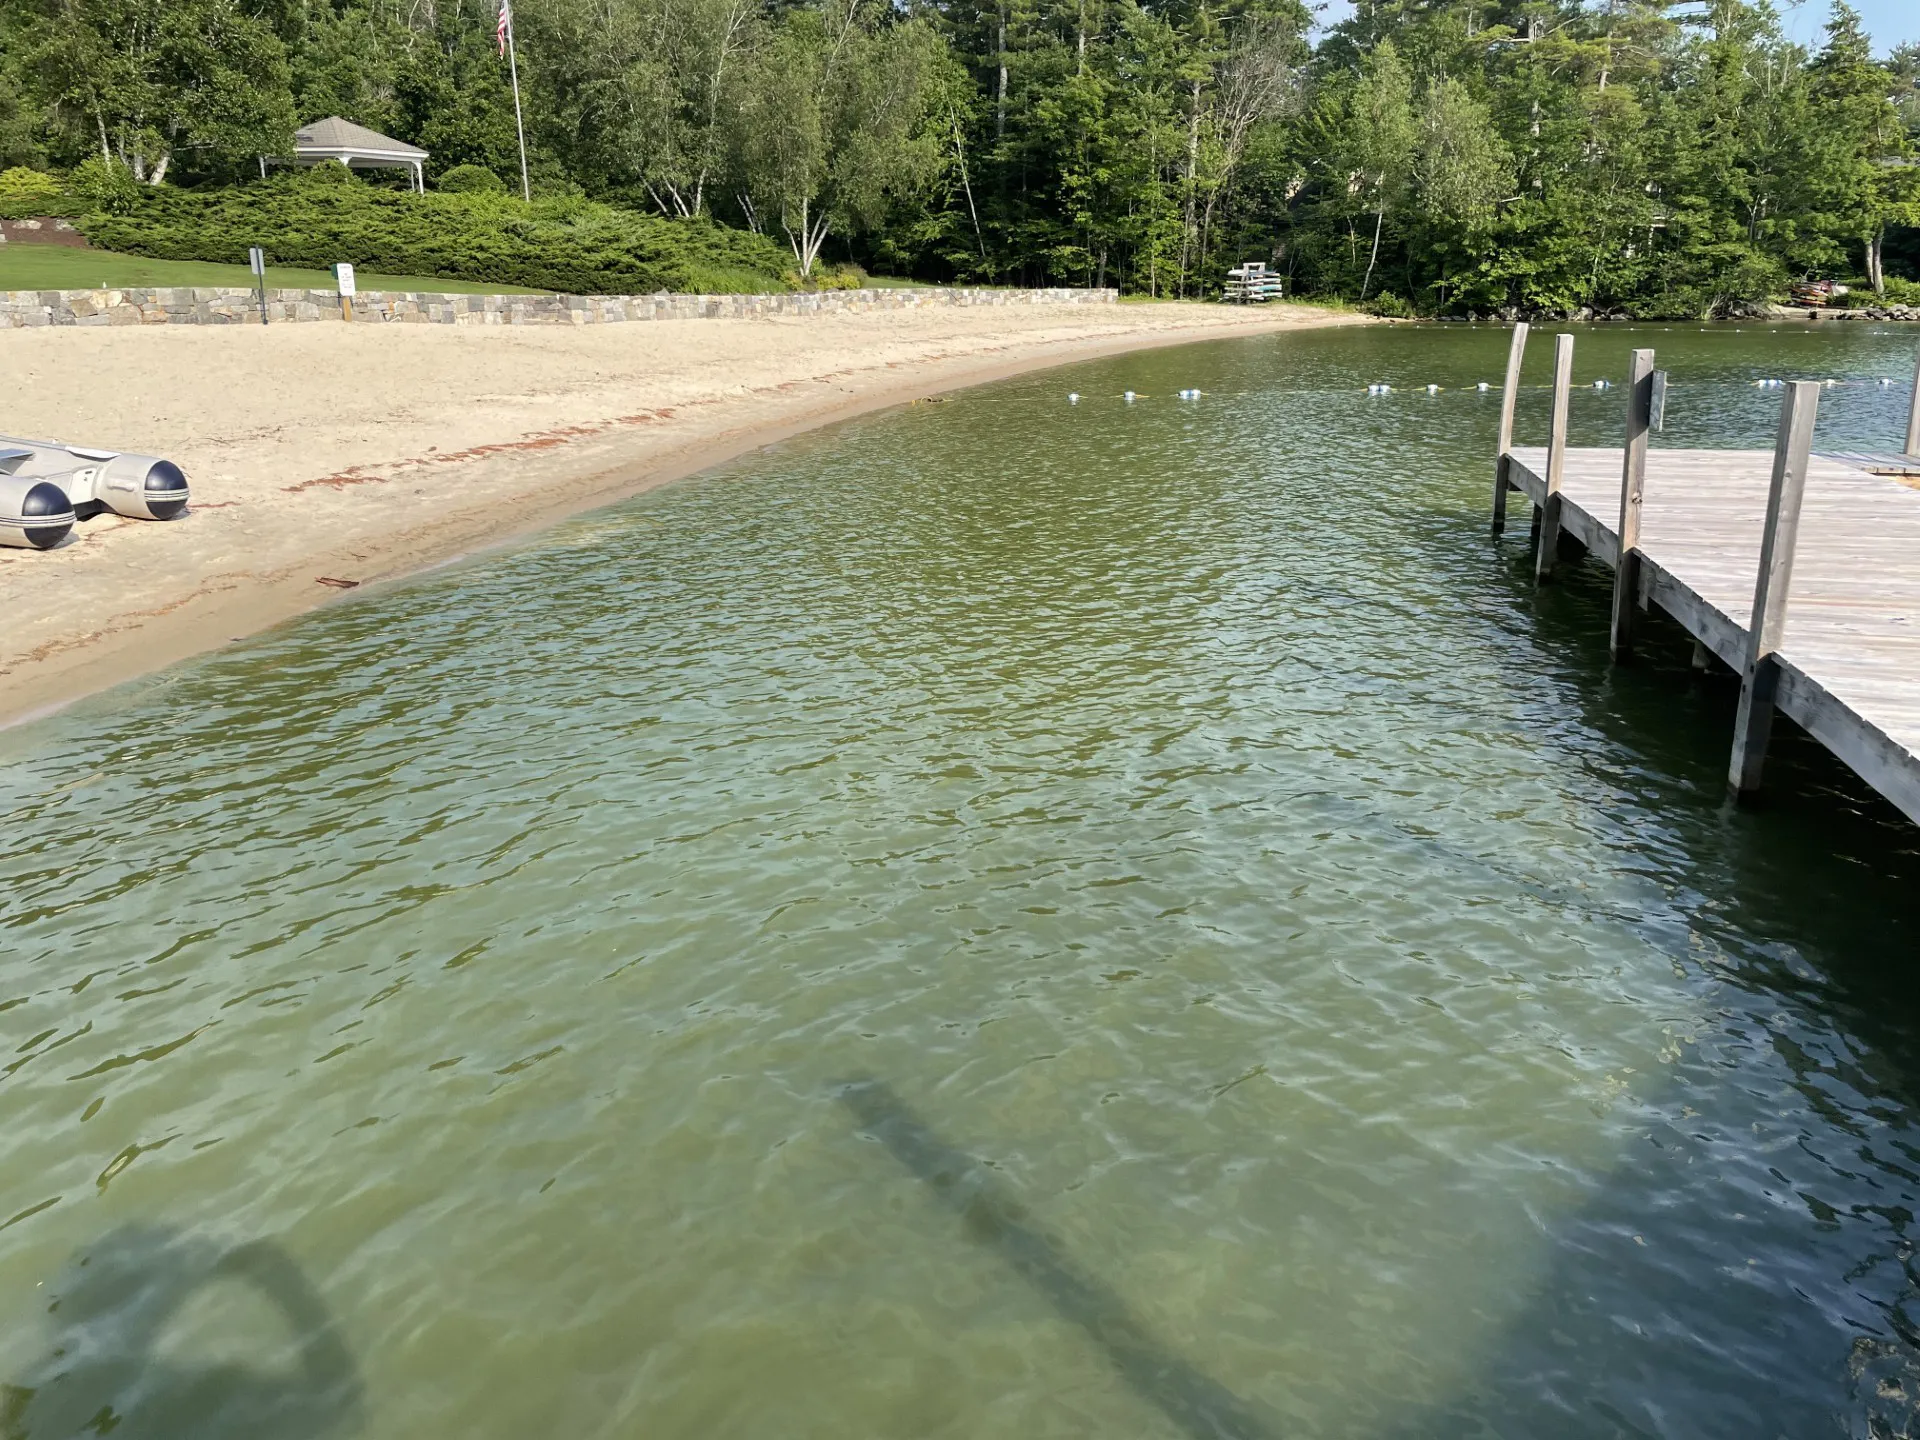
Intensifying Decline
As data-based projections show, if present trends continue, stress on Lake Winnipesaukee will intensify, degrading water quality and a lake-dependent regional economy.
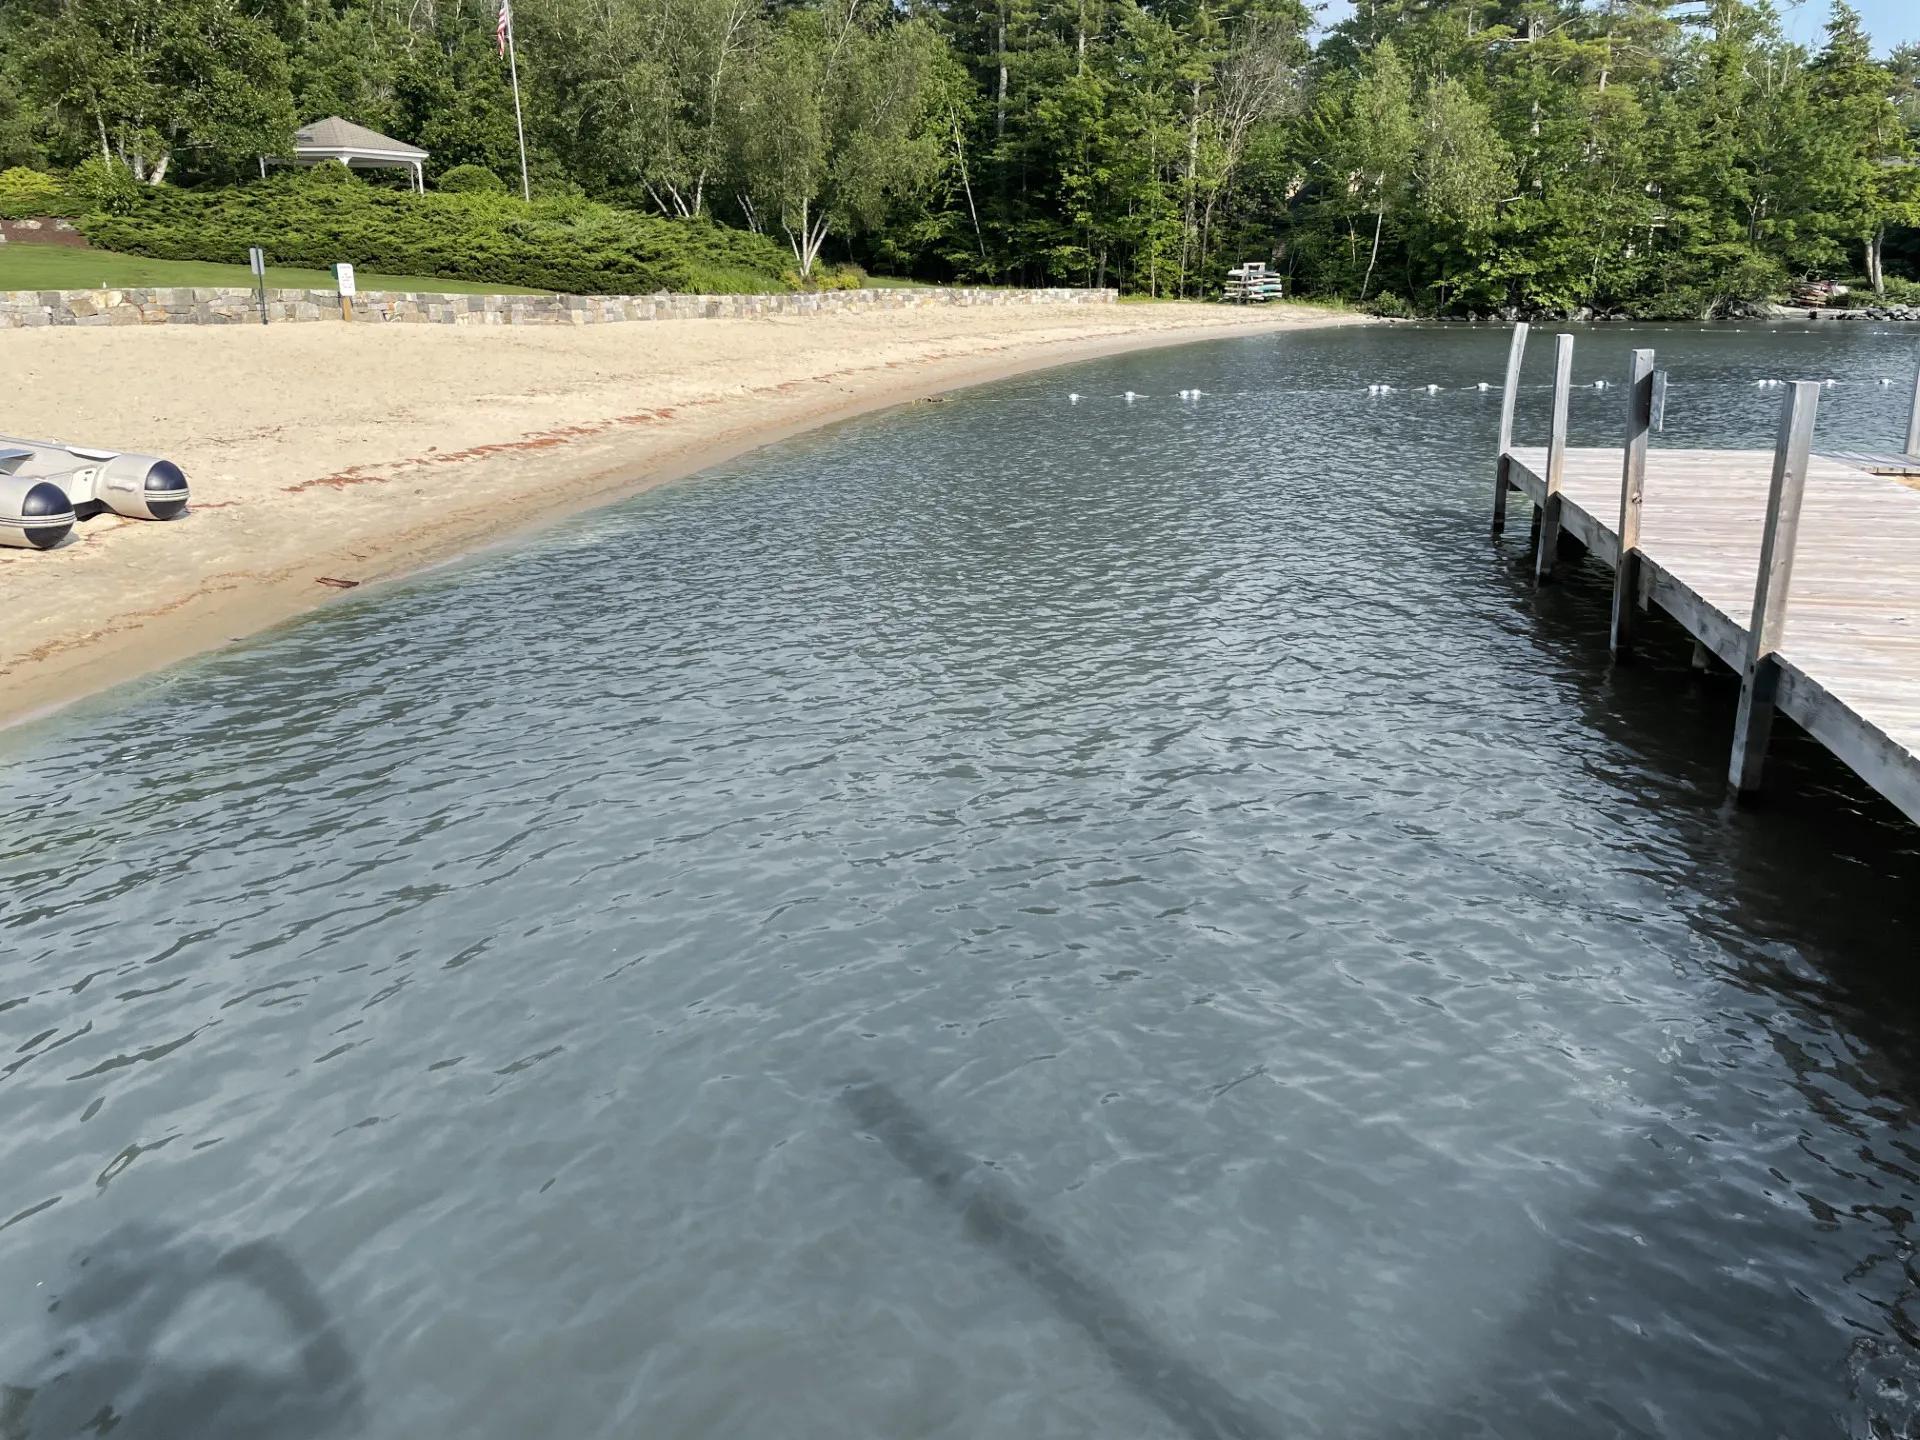
Increasing Resilience
By applying the data to guide changes needed to reduce stress on the lake, continuous improvements to water quality and increased natural resilience can be achieved.
(Image above altered to show comparison)

Our Lake. Our Choice.
The fate of Lake Winnipesaukee is at a critical crossroads, where the direction taken today will have profound future effects.
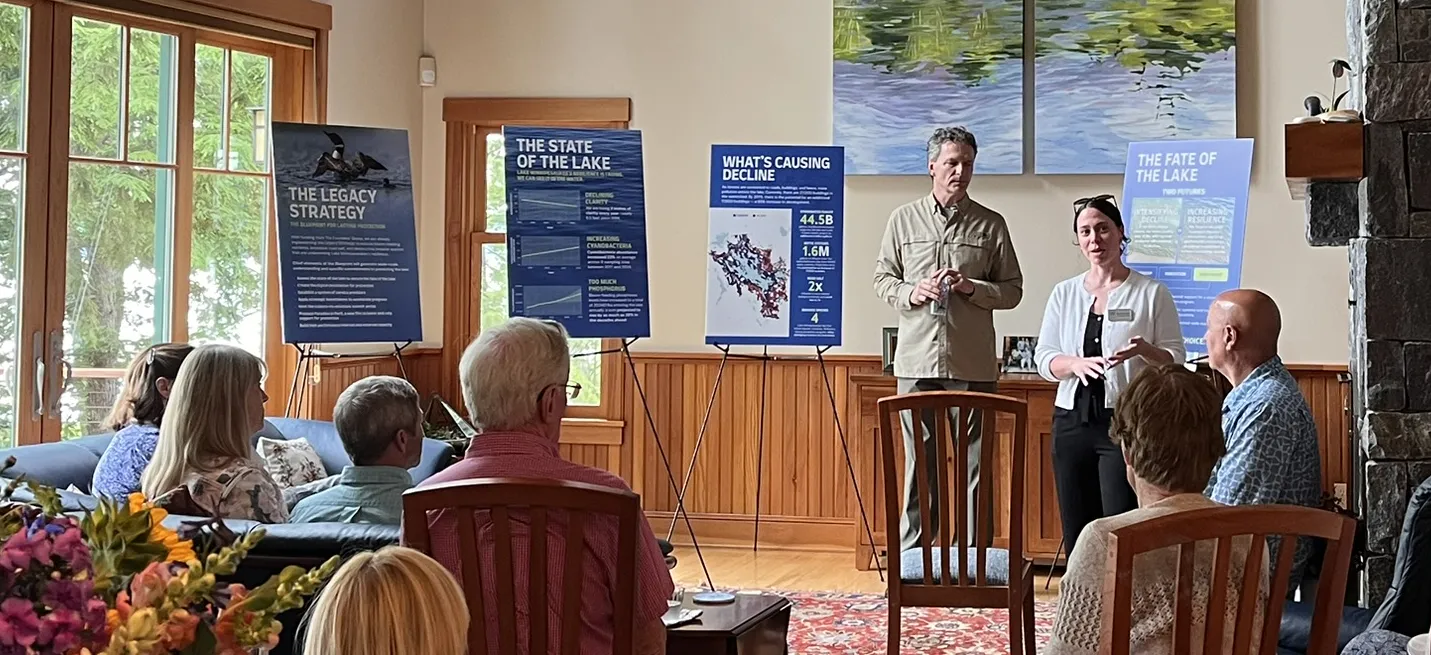
Applying Science to Inform Solutions
The science of the threats to Lake Winnipesaukee and the two futures now at hand provide the foundation for building sustained protection.
Analysis of current trends will inform the actions needed to curb projected declines and protect water quality. Projecting an alternative future that includes specific reductions of stormwater runoff, septic effluent, and salt, provides a compelling, science-guided basis for targeted solutions.
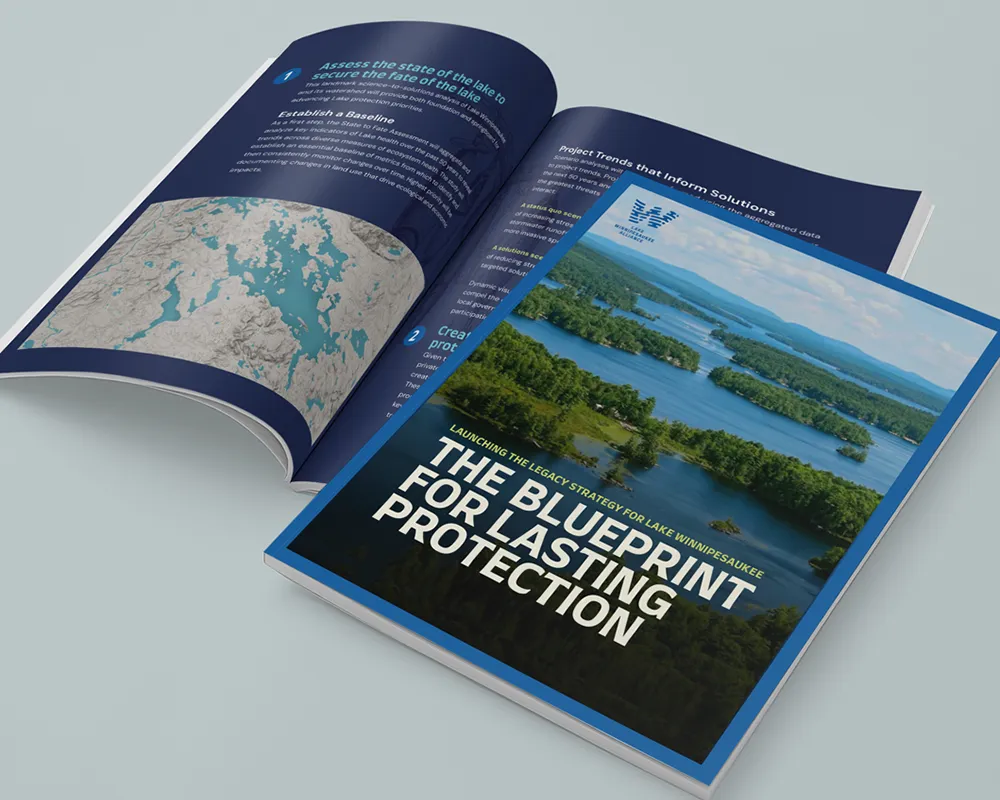
Blueprint for Lasting Protection
The LWA’s Legacy Strategy harnesses the science to produce responsive solutions. It fuses innovation, unprecedented partnerships, and, most important, direct investments to deliver results at the speed and scale mounting threats demand. The Strategy’s Blueprint for Lasting Protection informs as it empowers:
1
Innovation
Beginning with this assessment, an interactive digital platform will engage the diverse interests needed to produce sustained results. Given that the overwhelming majority of shorefront properties–the zone of maximum impact to water quality–are privately owned and almost entirely residential, new digital tools will guide property owners on how they can achieve measurable reductions of stormwater runoff, septic effluent, and chlorides that are impacting water quality. These new digital tools will be available for all property owners (private and public) in the watershed.
2
Partnership
A Service Provider System will streamline the process for achieving reductions and accelerating results. A breakthrough arrangement will be working with the existing, and extensive, network of contractors and property managers — Miracle Farms, Stephens, Piscataqua, Belknap, and many others — to become “Lake Protection Managers.” This expanded role will create a range of new services and market opportunities for these businesses. The Service Provider System will convert digital information into measurable action. In forming a watershed-wide system of Lake Protection Managers, LWA’s technical specialists (on staff and contracted) will conduct training in three main service areas — stormwater, septic, and salt. Trained Lake Protection Managers will work with identified subcontractors as may be required to implement recommended actions.
Alternatively, property owners will have the option of implementing recommendations on their own, with as-needed assistance from LWA’s skilled team. Opportunities for financial assistance from LWA – subject to resource availability and demonstrated need – will provide the means for all involved to do their part in protecting the lake.
3
Investment
As a cornerstone of the Legacy Strategy, direct investments in protection priorities will be the main accelerant for success. The Legacy Lake Fund will serve as the LWA’s financing engine to generate crucial momentum on implementing Legacy Strategy solutions at the fast pace necessary.
Leveraged Results
A longstanding lack of available public funding severely constrains the rate of response to threats that only grow more serious. The Legacy Lake Fund will break through an anemic status quo with targeted investments designed to produce leveraged results on key priorities. Examples include:
- Challenge funding to compel financial support from public and private partners for underwriting creation of a strong aquatic invasive species prevention program.
- Matching grants for upgrading septic systems and improving stormwater controls in high priority/high need locations as determined by this assessment.
- Seed support to stimulate early steps toward more meaningful action such as small grants for septic system upgrade plans or engineering proposals for stormwater improvements.
Building Momentum and Influence
Implementing the Legacy Strategy will build momentum and influence that move public policymakers to rise to their role as partners and leaders. This includes working to secure new funding and responsive public policies for enduring lake protection.
Join the Alliance

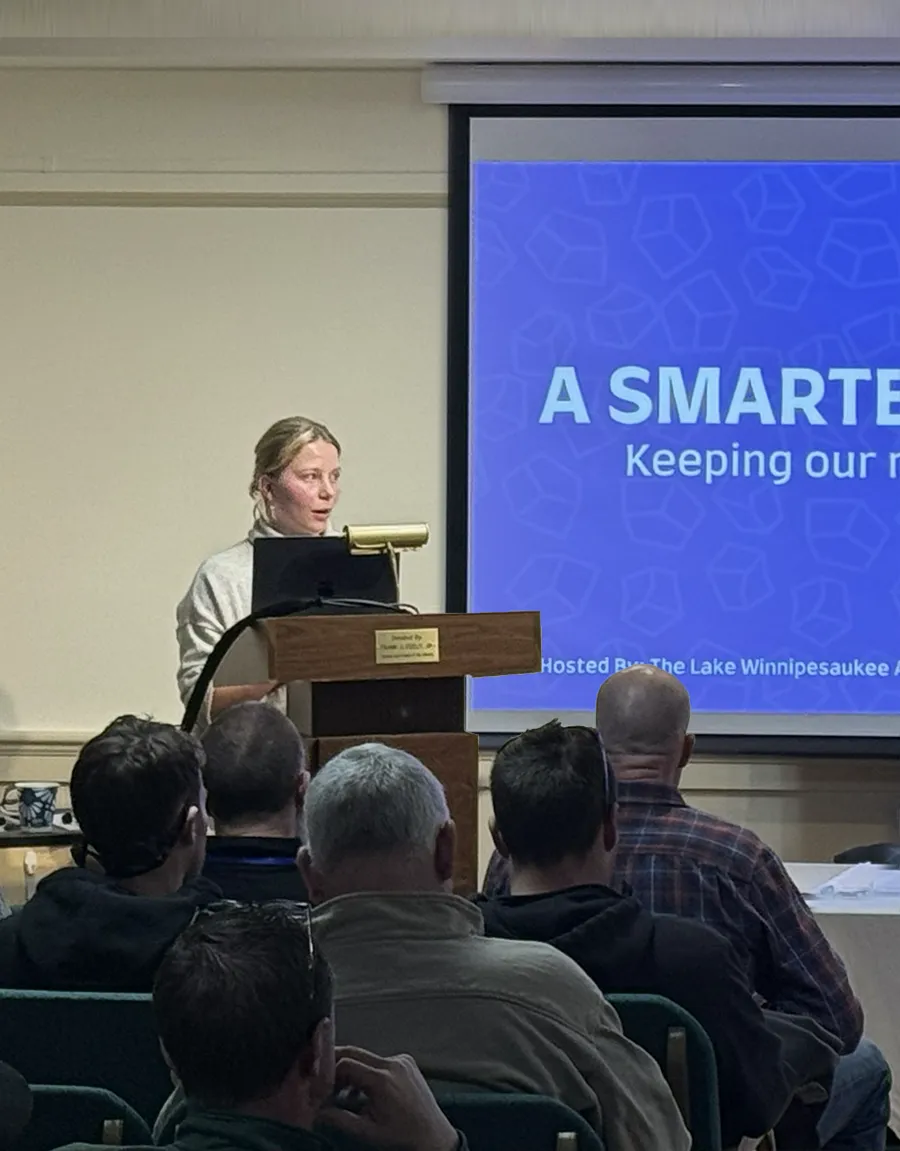


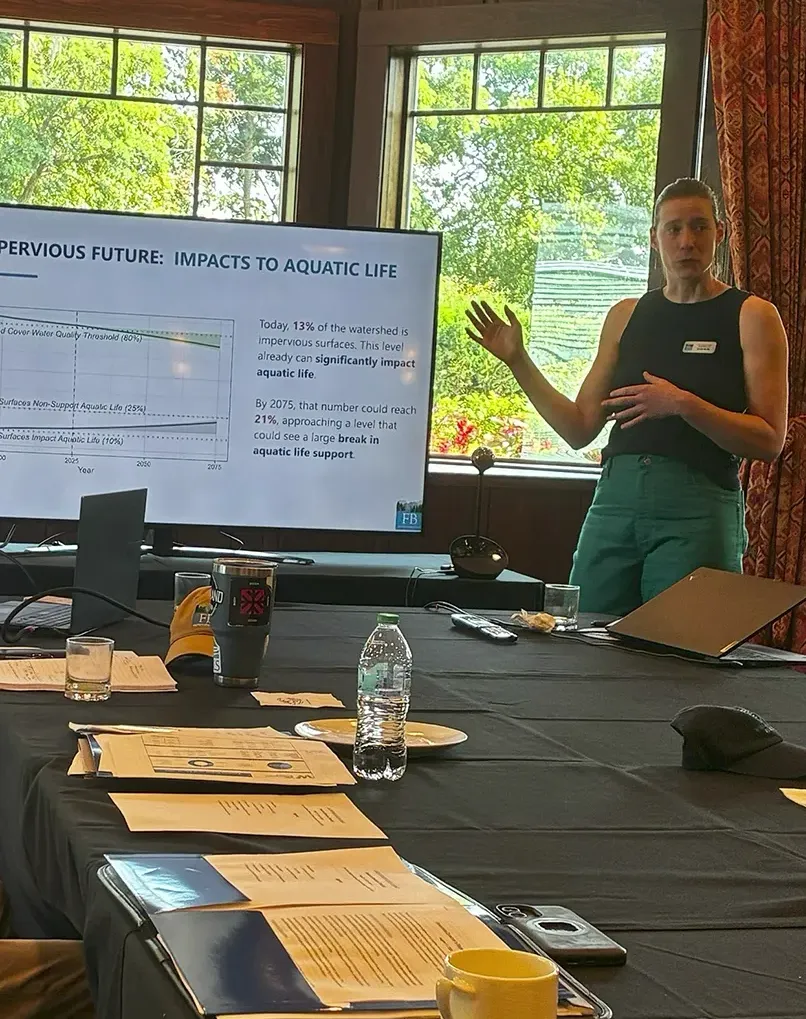

Join the Alliance
Who Will it Take to Save the Lake? Everyone.
Saving Lake Winnipesaukee from intensifying decline can only be achieved through the concerted commitment of all those with a stake in the fate of the lake. As shown by science, the scope of the challenge and the vital importance of a healthy Lake Winnipesaukee require all sectors to take part. From property owners to businesses to public officials, and more, everyone has a role to play.
Rising to the challenge, the role of the Lake Winnipesaukee Alliance is to facilitate the actions needed by working with every sector as active partners in this essential pursuit. The success of the LWA’s role will be measured by the contributions from each of our partners.
The list of partners and their roles is inclusive because it is the only way results will be achieved at the pace and scale needed to curb mounting threats:
Partners in Protecting Lake Winnipesaukee
Service Providers
- Architects
- Builders
- Contractors
- Developers
- Landscapers
- Property Managers
- Septic Services
Businesses
- Hospitality
- Marinas
- Realtors
- Retailers
- Clubs
- Recreation & Tourism
Volunteers/Organizations
- Property Owners
- HOAs
- NGOs
- Chambers of Commerce
- Municipalities
- Visitors
Investors/Donors
- Individuals & Families
- Foundations & Trusts
- Public Programs
If you’re on the list, you have a role to play as a partner and a key contributor to the living legacy of a healthy Lake Winnipesaukee. Become part of the solution by learning what you can do to save Lake Winnipesaukee.
Become an Alliance Partner Today
By signing the Lake Protection Compact, you will become part of a history-making partnership of people who love Lake Winnipesaukee and are leading by example as participants in protection. “When the people lead, the leaders follow,” and nowhere do these words ring true more strongly than in stepping up to the challenge of what it will take to save Lake Winnipesaukee.
OUR TIME TO ACT IS NOW.
THE LAKE WILL NOT WAIT.

Our Lake. Our Future.
Dedicated to protecting the water quality and natural resources of Lake Winnipesaukee and its watershed for the benefit of all who love the lake.
This landmark assessment has been made possible by LWA’s Founders’ Group, whose current members are listed here. Founders are funding the launch of the LWA’s Legacy Strategy—the most ambitious endeavor ever undertaken to safeguard the lake. The strategy combines advanced research, powerful digital technologies, purposeful engagement, and direct investment to protect the lake for generations to come.
The Founders’ Group is fueling our progress on implementing all elements of the Legacy Strategy through donations and pledges of $100,000 or more. We are deeply grateful for their leadership at this pivotal time for the lake.
The Founders’ Group
- Miriam Adams and David Edelman
- Roy and Sandy Ballentine
- Steven and Carolyn Elterich
- Beth and David Geduld, MD Family Foundation
- Eric Gibson and Jeannie Pearce
In Memory of Timothy and Sally White - Peter and Kerstin Glick
- Gail Goodman and Dave Swindell
- Debbie M. Harrison
- Carrie and Rich Higgins
- Dana and Lynn Huff
- Mark and Ginger Ishkanian
- Kenneth and Brenda Korach
- John W. Marriott III
- Bob and Margery Mueller
- Emery and Barbara Olcott
In Memory of Timothy and Sally White - Ann and Rob Quandt
- Paul and Sharon Steinwachs
- The Vanderheiden Family
- Kathleen B. Walgreen and Michael R. Camino
- Eastern Propane and the Clement and Anderson Families
- Anonymous